As a manufacturer, you need to know if your processes are stable and in control or unstable and out of control. This is imperative in measuring, tracking, and maintaining quality.
New Feature Alert: We recognize this importance; control charts are now a feature within Nulogy Smart Factory.
In this blog, we’ll talk about what a control chart actually is, how it’s used, and finally, walk you through how you’d use a control chart within Nulogy Smart Factory.
What is a Control Chart?
Control chart: A control chart is one of the primary techniques of statistical process control (SPC). The control chart is a graphical display of quality characteristics that have been measured or computed from a sample versus the sample number or time. The control chart was invented by Walter Shewhart at Bell labs in 1920.
Statistical Process Control: Statistical Process Control (SPC) is a statistical method to measure, monitor, and control a process. In other words, SPC is a method of quality control that employs statistical methods to measure, monitor, and control a process.
The concept of Statistical Process Control (SPC) is a primary tool, prescribed by the methodologies of Six Sigma, to improve quality by reducing process variation.
A control chart plots data over time to identify fluctuations in a process.
The keyword here is process control. Let’s say there is a process with a metric you want to track and ensure stays stable. Maybe, it’s cycle time, for example. A control chart will monitor cycle time for any fluctuations.
Another example is temperature. Maybe it’s a refrigerator and you need that temperature to stay within a particular range of control. You would use a statistical process control chart to monitor these metrics, and more.
New Feature: Control Charts in Nulogy Smart Factory
Within Nulogy Smart Factory, manufacturers now have the ability to use control charts to understand process changes over time. Is a particular process out of control or not?
These graphs are typically used in accordance with preventive maintenance, providing a critical measurement that will tell if the product is going to be of good quality or not. If a measurement is not within pre-set boundaries, there is a potential quality issue.
There are many types of control charts, each with a specific purpose. Knowing which chart will be most beneficial is going to be dependent on what is being produced at the plant.
A few weeks ago, we added this capability to the Nulogy Smart Factory platform. We now support 3 different control charts, with greater detail provided in the next section.
What We Support
We support 3 types of control charts: X-Bar, R, and S charts. Typically, the control charts are viewed in pairs, either an X-Bar with an R chart or an X-Bar with an S chart.


These types of charts can be used in a lot of places. Basically, anything you want to control and make sure remains consistent can be monitored by a control chart.
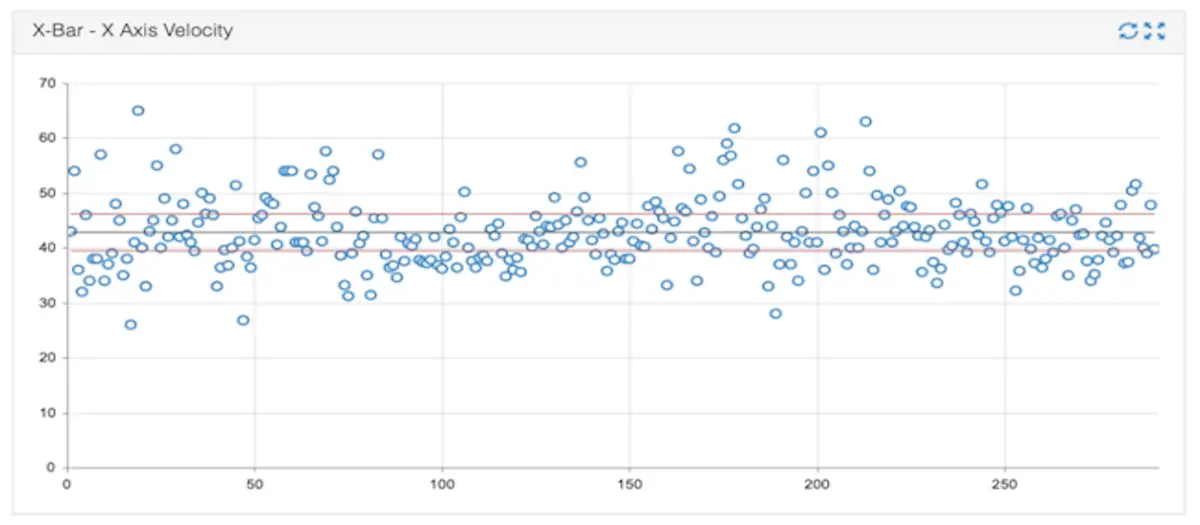
So, let’s dive into greater detail. In an X bar chart, X is a sample value like cycle time or temperature. Each one of the dots is an average of a certain number of samples in a subgroup. This average of X is called X Bar.
The gray center line is the Mean (or average) of those averages, also called the X Double-Bar. The red lines above and below are the Upper Control Limit (UCL) and Lower Control Limit (LCL). The UCL and LCL are calculated with a standard formula. Ideally, the subgroup averages, that is, the dots, should remain within those limits. Any X Bar value that falls above the upper limit or below the lower limit could be considered “out of control”.
The R Chart is used to visualize how widely the process varies over time. Each dot on the R Chart represents the range of values in each subgroup. This range of X is called R. And, like the X Bar chart, the Mean, UCL, and LCL represent the average of the ranges (also called R Bar) and the upper and lower control limits.
The S Chart is similar to an R Chart in that it measures the variation of the process. But instead of using a range of values, each dot represents the standard deviation of the values in each subgroup. This standard deviation of X is called S. And like the X Bar and R Chart (you guessed it!), the Mean, UCL, and LCL represent the average of the standard deviations (also called S Bar) and the upper and lower control limits.
The purpose is to look at all of these values together to provide a complete picture of what’s happening. It’s an indication of how stable the processes are.
In Nulogy Smart Factory, the data is measured at a continuous pace, sampling and measuring data at 5-minute intervals. This helps manufacturers identify variations over time.

