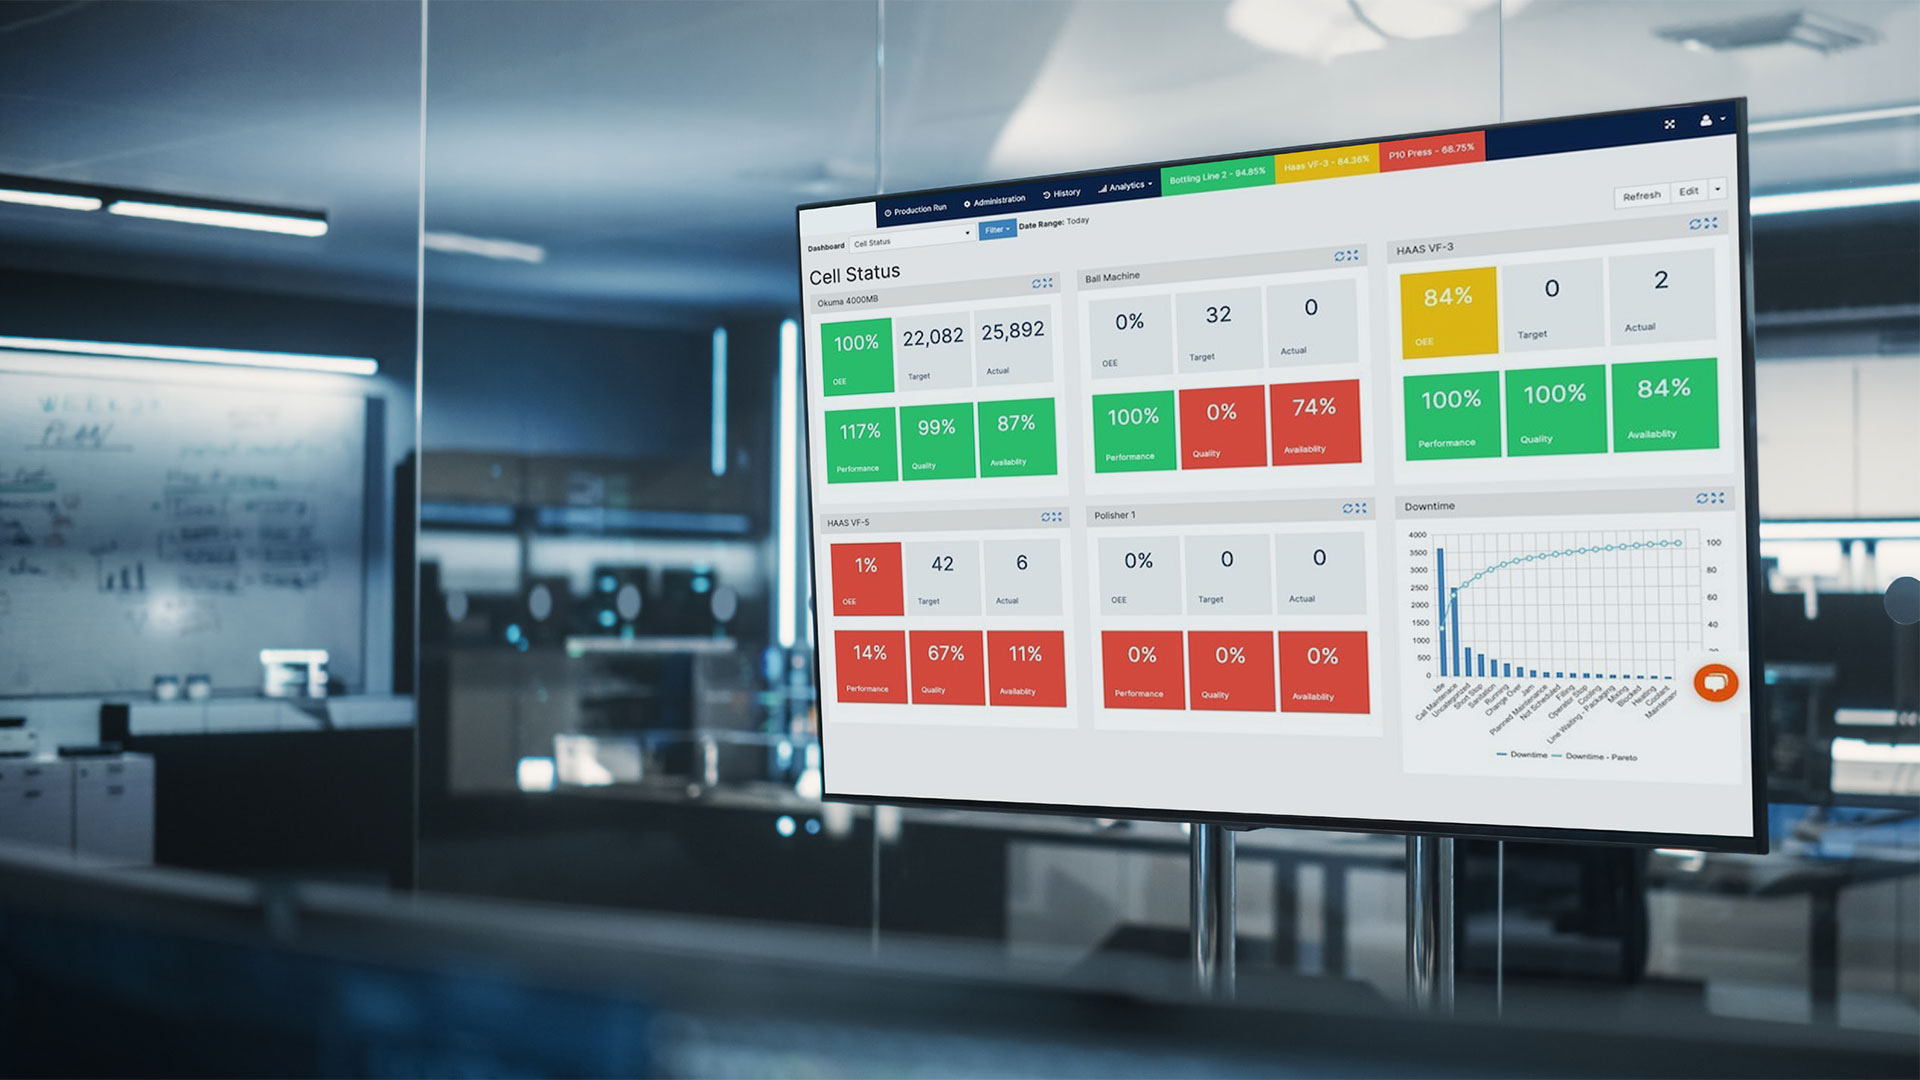
Walk onto almost any plant floor running some form of production monitoring software and you’ll see a screen at the end of the line: green when the line is hitting target, red when it isn’t. Visual scoreboards have been a staple of lean manufacturing for two decades, and for good reason. They give an operator an instant, glanceable read on whether the shift is on pace. A scoreboard showing red doesn’t tell anyone why the line is behind, and that gap is where a lot of plants get stuck.
What a standalone visual scoreboard is built to do
Traditional andon-style scoreboard hardware is purpose-built for one job: display real-time status, usually OEE, count, and target, on a screen the whole line can see. It’s a proven, simple approach, and for a single line with a stable process, it can be enough. The limitation shows up as a plant scales past one or two lines, or as the causes of downtime get more varied than a single glance at a red light can explain.
Where a standalone scoreboard runs out of road
A scoreboard tells you the line is behind target. It generally can’t tell you whether that’s because of a changeover running long, a specific machine’s fifth micro-stop of the shift, or a material shortage two stations upstream. Getting that answer usually means a supervisor walking the floor to ask, which works at one plant with one line, and becomes unmanageable across multiple sites.
What changes with a connected, AI-assisted system
Nulogy Smart Factory keeps the visual scoreboard idea, color-coded targets, real-time progress, visible from the floor, but connects it to the underlying event data: every stop, every scrap unit, every changeover, classified by reason code and asset.
That’s the difference between a light that turns red and a system that can explain why, in the same view a supervisor is already looking at. See how this ties back to plant floor data visibility more broadly.
Nora, the AI assistant built into Smart Factory, goes a step further. Instead of a supervisor digging through a report to find the root cause, they can ask directly, “why is Line 3 behind today?” and get an answer drawn from the actual event history, not a guess. Read more on how Nora answers questions supervisors ask every shift.
What this looks like for a team already running visual management
“Smart Factory has given us a clear picture on how downtime is influencing the production of kits, as well as how our operators factor into overall performance. We were able to differentiate between the factors affecting how our kits are being produced and fulfilled,” says Rahul Alagusundaram, Production Planner at LetsGetChecked Ireland. That kind of differentiation, separating a machine issue from an operator issue from a material issue, is exactly what a color-coded light alone can’t show.
Choosing between the two approaches
A standalone scoreboard is a reasonable starting point for a single line with a simple process and a supervisor who’s already close to the floor every shift. It becomes a limiting factor once a plant runs multiple lines, multiple shifts, or wants the root cause of a stoppage available without someone walking over to look.
If your team already knows the line is behind but keeps needing a person to explain why, that’s usually the sign it’s time to connect the scoreboard to the data behind it. See how real-time OEE tracking works, or read about what causes micro-stops most plants never see.
The goal isn’t to replace visual management, it’s to make the visual signal explainable. Request a demo of Nulogy Smart Factory to see how a connected scoreboard compares to what’s on your floor today.