Production Monitoring ROI Calculator

Enter a few numbers about your plant to estimate the return on production monitoring. The return comes from minutes you win back on every shift, and you can only win back time you can see. Nulogy Smart Factory, along with Nora, our built-in AI assistant, shows downtime and small stops as they happen, so your team can act before they cost a shift.

  • Track OEE, downtime, and performance in real time
  • Replace spreadsheets and manual production reports
  • Give every team visibility across the plant
0%+ Increased OEE
0%+ Reduced Downtime
0% Inventory Accuracy

See Production Monitoring in Action

Calculate Your ROI

Production monitoring ROI comes down to two questions: how many minutes of machine time can you win back on each shift, and what is each of those minutes worth? Enter your plant’s numbers below to see the payback. Want to find out where your time goes first? Try our OEE calculator or cycle time calculator.

Calculator
Smart Factory ROI Calculator
Enter your plant’s numbers to estimate the yearly value of recovered machine time and how quickly Nulogy Smart Factory pays for itself.
How many you would monitor.
$
Average cost to run one machine for an hour, including labor and overhead.
Days you typically run.
Shifts you typically run each day.
Length of a typical shift.
Downtime and small stops you expect to win back. Start conservative.
First-year ROI
—
Value recovered / year—
Smart Factory / year—
Net gain / year—
Hours recovered / year—
Payback—
Talk to us about these numbers
Assumes $995 per machine per year for Nulogy Smart Factory and 52 working weeks. Your quote depends on tier and site size. Updates as you type.

understanding roi

Where Production Monitoring ROI Comes From

Every minute a machine sits idle during a scheduled shift still costs you labor and overhead. Production monitoring pays for itself by giving some of those minutes back, and most of the value comes from three places:

Unplanned downtimeWhich stops cost the most hours?Nulogy Smart Factory tags every stop with a reason, so you work the biggest losses first instead of the loudest ones.
Small stopsWhere does time leak without anyone noticing?Short stops and slow running rarely make it onto a paper log. Automatic downtime detection counts every one.
Response timeHow fast does the right person find out?Automatic alerts reach supervisors the moment a line stops, not at the end of the shift.

Ten minutes per shift sounds small. Across 10 machines running one shift, five days a week, it adds up to more than 430 hours of machine time a year.

How This ROI Calculator Works

The calculator turns minutes recovered on each shift into hours and dollars per year, then compares that value with the cost of Smart Factory.

Hours recovered
Machines × Shifts × Days × 52 × Minutes ÷ 60
Value recovered
Hours Recovered × Cost per Machine Hour
Smart Factory cost
Machines × $995 per year
ROI
(Value − Cost) ÷ Cost
Worked example
  1. Hours recovered. 10 machines run one 8-hour shift, five days a week. Winning back 10 minutes per machine per shift gives 10 × 1 × 5 × 52 × 10 ÷ 60 = 433 hours a year.
  2. Value recovered. At $80 per machine hour, 433 hours is worth $34,667 a year.
  3. Cost. Ten machines at $995 each is $9,950 a year.
  4. ROI. ($34,667 − $9,950) ÷ $9,950 = 248%. The recovered time covers a full year of Smart Factory in about 15 weeks.

Getting an Honest Estimate

A few habits keep the estimate grounded in your plant, not a sales pitch:

Default
10 minMinutes recovered per machine, per shift
First-year OEE gain
10–20%What most Smart Factory customers see
H&T Waterbury
71%Fewer micro-stoppages with Smart Factory

Use your real cost per machine hour. Include operator labor and overhead for the time a machine is scheduled to run. Leave out selling price and margin, which overstate the value of a recovered minute.

Expect more downtime than your reports show. Manual logs miss short stops and slow running, so the minutes you can win back are often higher than they look on paper. H&T Waterbury cut micro-stoppages by 71% and eliminated nine hours of weekly downtime once those stops became visible.

Treat the result as a floor. The calculator counts only recovered machine time. It leaves out gains from less scrap, fewer manual reports, and faster changeovers.

Smart Factory Platform

OEE Software for the Factory Floor

Stop waiting until the end of a shift — or the end of the week — to understand what happened on your shop floor. Nulogy Smart Factory gives manufacturers a live production monitoring system to track OEE, downtime, scrap, throughput, and line performance from a single connected dashboard.

View Production Monitoring Demo


Trusted by leading manufacturers

HelloFresh Ice Industries Louisiana Fish Fry Cresco Igloo PB2 Foods LetsGetChecked Heitkamp & Thurman Batteries
Nulogy – Logo Carousel
If we could save fifteen minutes on machine time per operator, just by eliminating paperwork to be more efficient — we calculated we could save over $75,000. We have easily saved over $100,000 just in efficiency and paperwork alone.

Daniel Rhodus
Quality Manager, Lincoln Manufacturing USA, LLC
Lincoln Manufacturing Manufacturing Smart Factory customer

OEE Monitoring Software For Real-Time Visibility

Get the real-time visibility you need to understand what is happening across every line, shift, and site, without waiting for spreadsheets, manual updates, or Monday morning reports.
Nora by Nulogy

Part of Nulogy Intelligence

Ask Nora. She Answers, Charts It, and Acts.

Nora is the manufacturing AI assistant built into Smart Factory and Maintenance. No dashboards to dig through. Ask in plain English and watch what comes back.

Tap a question to see Nora work

Your data stays yours. Nora never fabricates an answer, learns your line names and part numbers, and is never used to train external models.

View Demo
Push, Not Pull

You Don't Open Nora. Nora Comes to You.

Every other AI assistant on the plant floor waits to be asked. Nora is built to flip that.

Every Other AI

You notice the problem, then go ask. By then the line was already down.

-73% Downtime

“What gets tracked, gets improved.”

Matt Hill, Operations Improvement Coordinator at H&T Waterbury
Matt Hill Operations Improvement Coordinator, H&T Waterbury
+30% OEE

“Reduction in overtime was exactly what we were looking to do… and that’s exactly what we have achieved.”


Chad Hill, CEO at Versatech
Chad Hill CEO, Versatech View on LinkedIn
+9x Return on Investment

“The real-time reporting at the manufacturing level is the biggest benefit.”

Ben Wohlschlaeger, Business Process Optimization Manager at Tacony
Ben Wohlschlaeger Business Process Optimization Manager, Tacony View on LinkedIn
+25% OEE

“Now that we have the transparency into the process, our OEE availability has increased significantly.”


John Bowers, VP of Operations at Oral BioTech
John Bowers VP of Operations, Oral BioTech View on LinkedIn
John Bowers, Vice President of Operations at Oral Biotech
John Bowers Vice President of Operations
Production Monitoring Customer Success Story
99.8% Scrap Reduction

Oral Biotech used Nulogy Smart Factory to replace manual production reporting with real-time production monitoring. By capturing live shop floor data - including previously missed short stops - the team gained better visibility into performance issues, improved line efficiency, increased OEE from around 60% to close to 80%, and significantly reduced scrap and rework.

Read Case Study
Accurate production data in real time

Finding The Right OEE Monitoring System

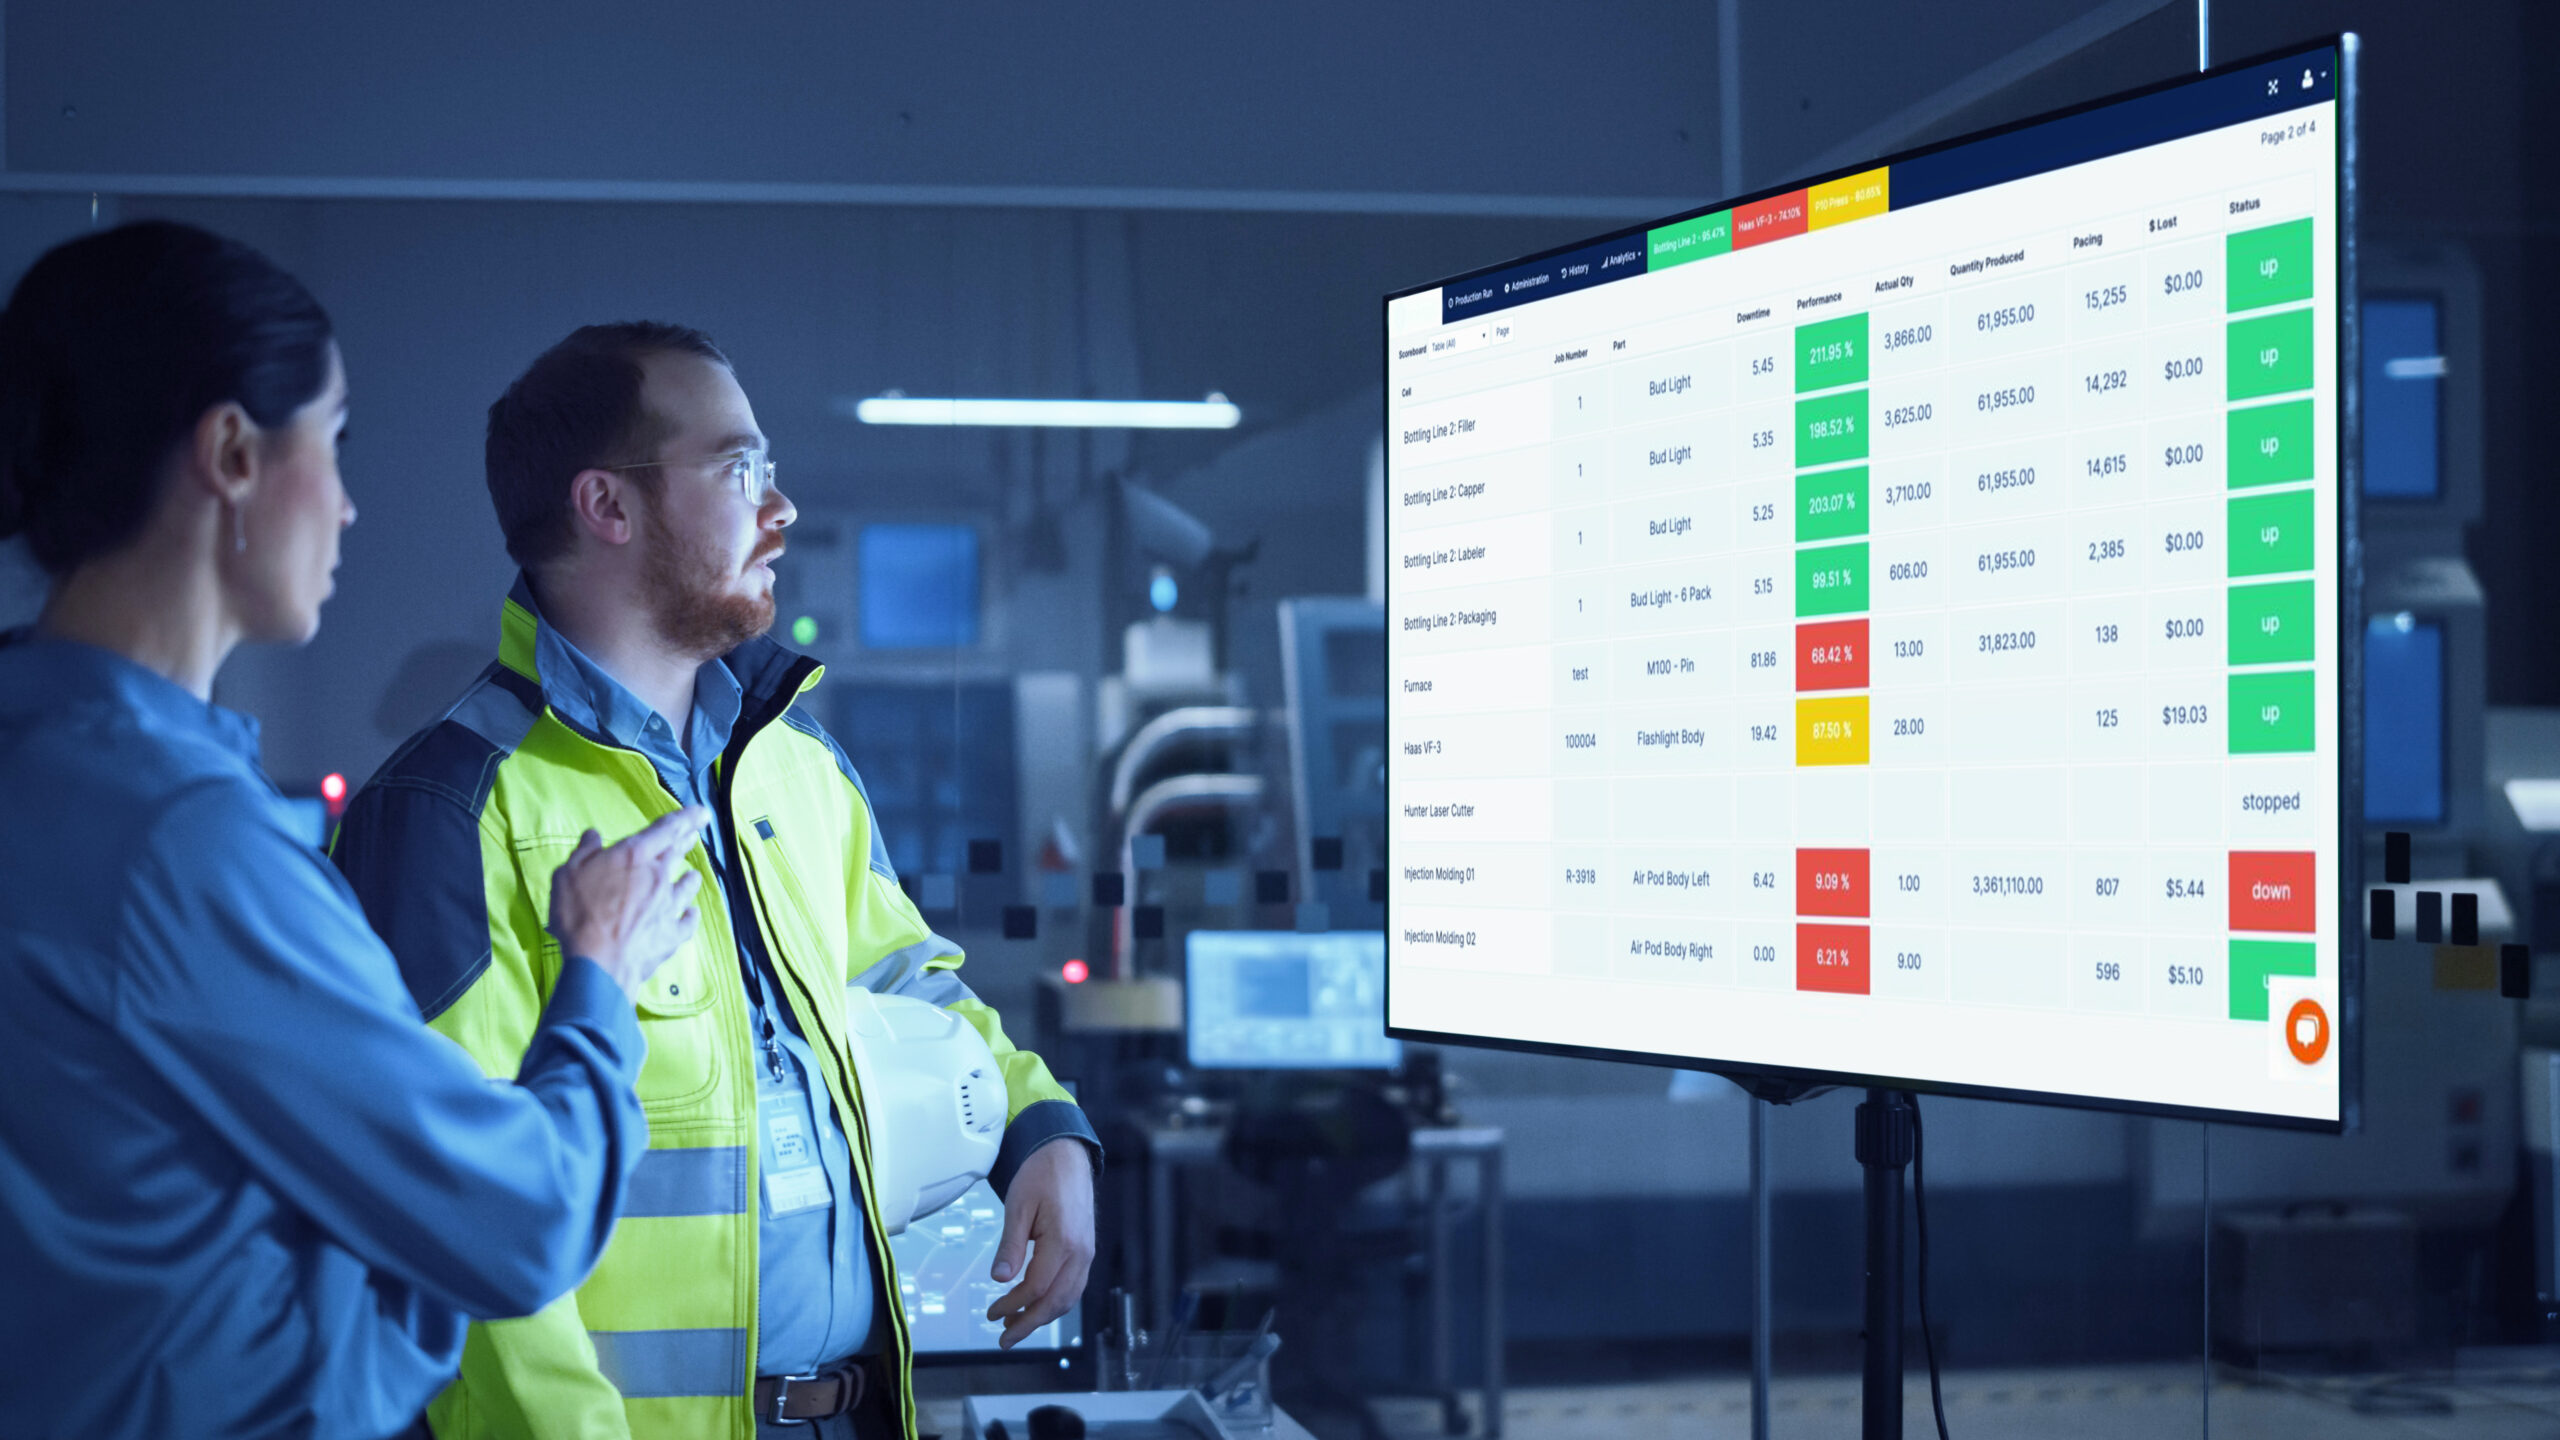
Nulogy Smart Factory connects to your existing equipment — no rip-and-replace — and starts capturing live production data in days, not months. Track OEE, downtime, scrap, throughput, and line performance from a single connected dashboard across every shift, line, and site.
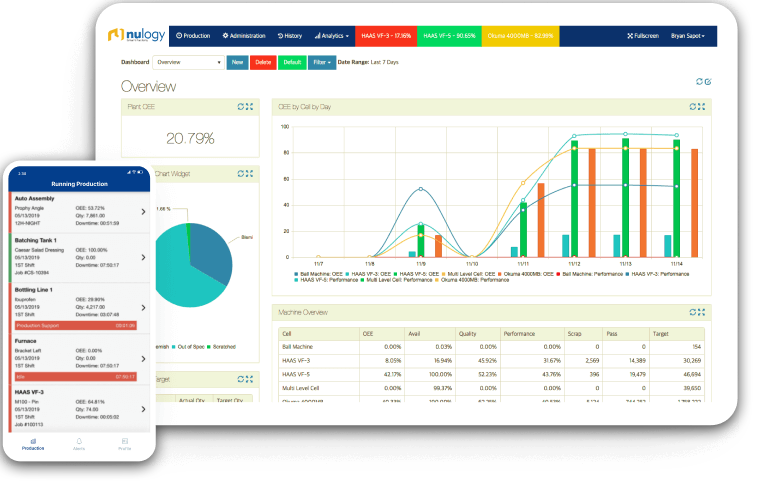
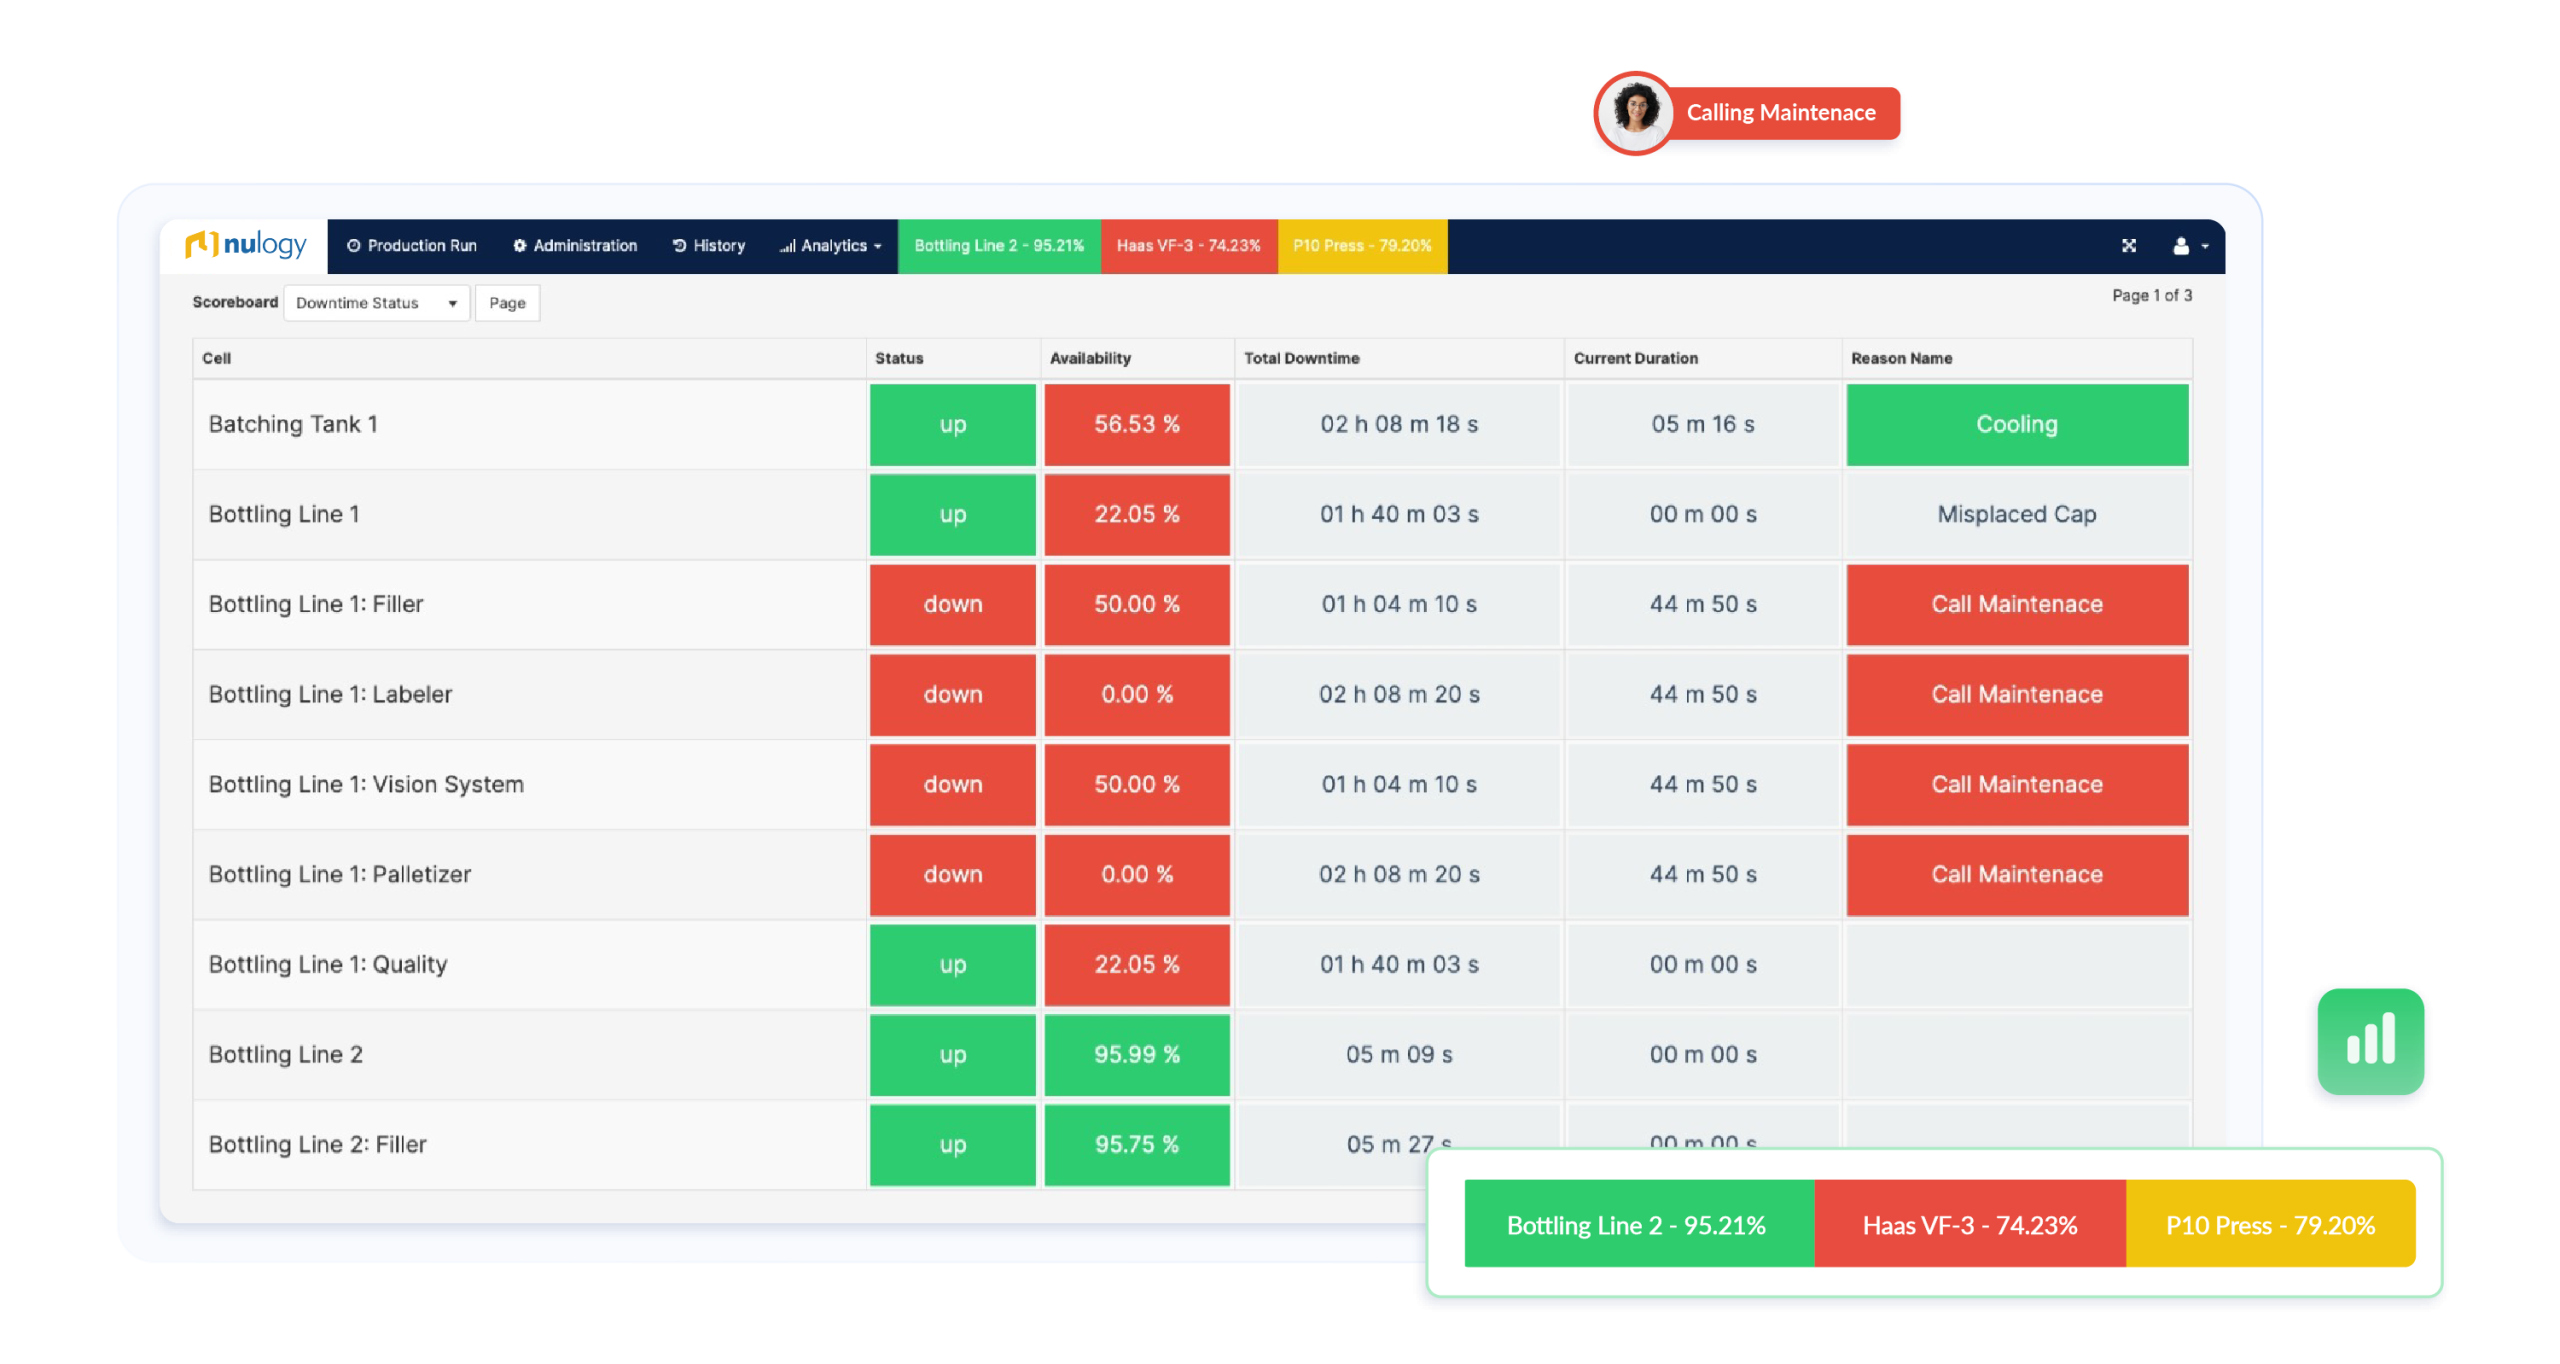
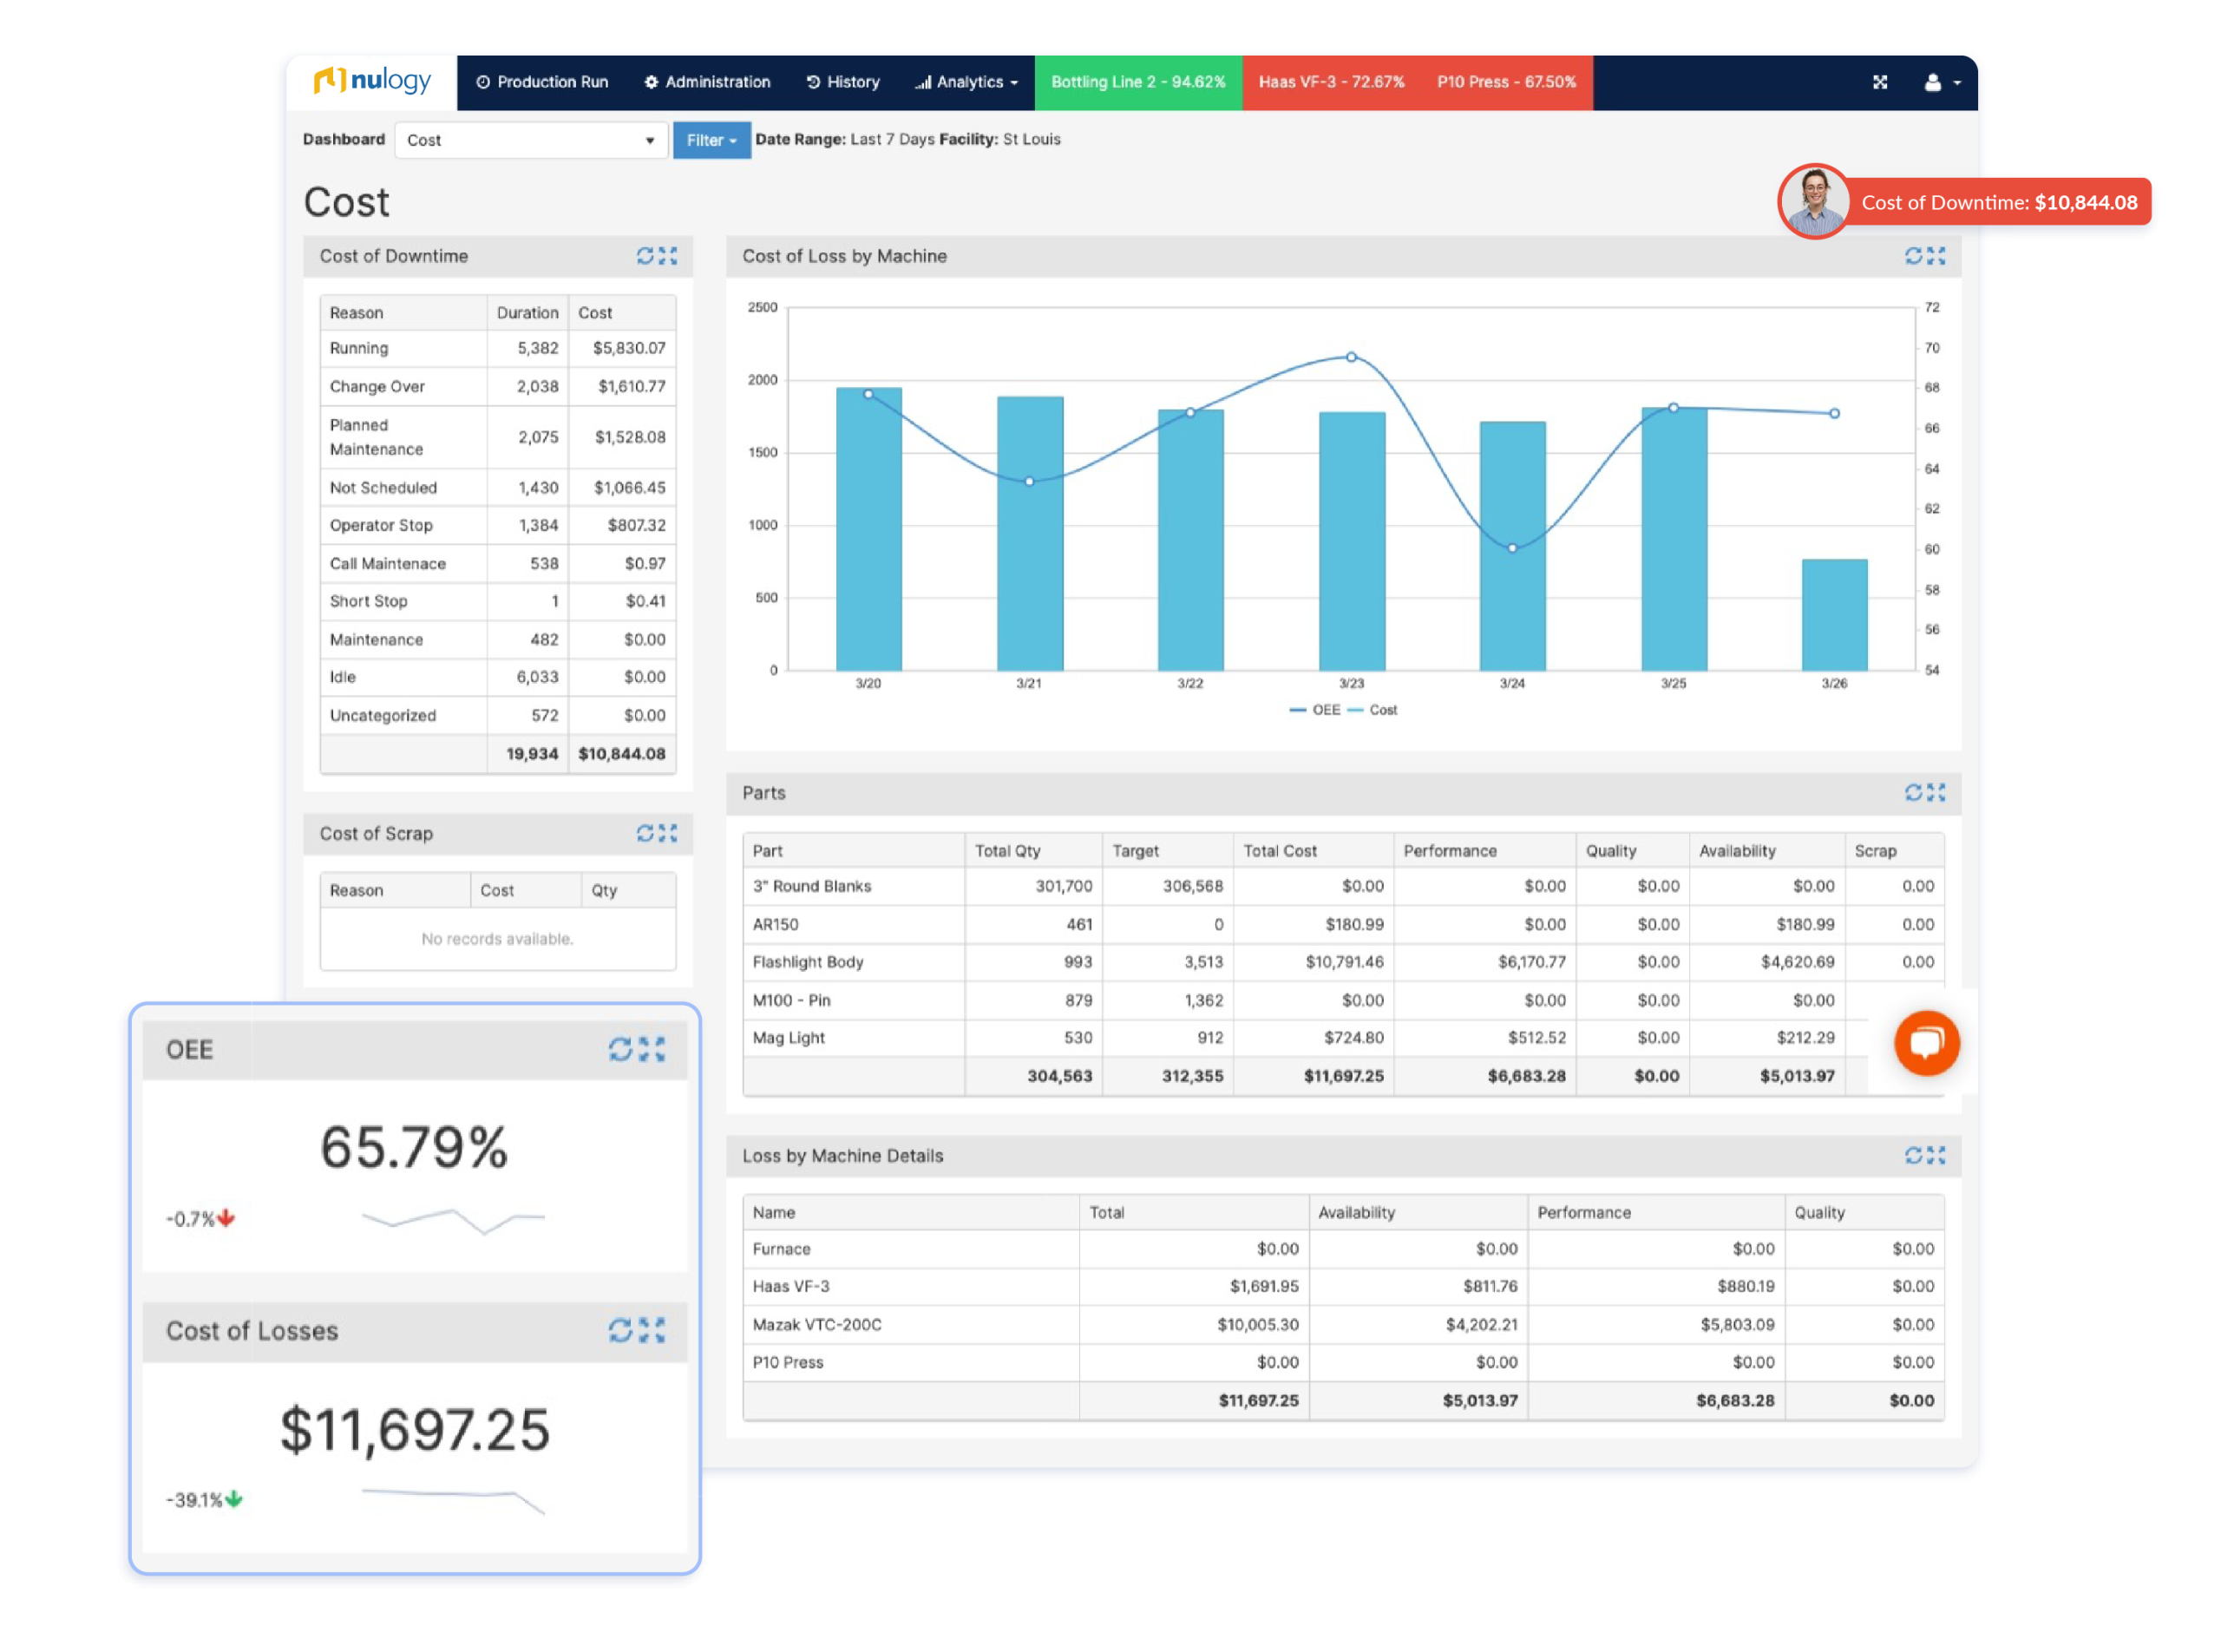
Nulogy Smart Factory production overview dashboard showing OEE, line performance, and real-time production counts
× Live OEE score See your Overall Equipment Effectiveness updating in real time — no manual calculation required.
× Performance trend chart Track actual vs target production over any time period to spot patterns and plan improvements.
× Running production Live operator screen shows current job, cycle time, and count — updated automatically from the machine.
Nulogy Smart Factory OEE tracking showing availability, performance, and quality breakdown by machine and shift
× Availability See the percentage of scheduled time your machines are actually running — and when they stopped.
× Performance rate Compare actual cycle time against ideal cycle time to surface hidden speed losses on every line.
× Quality rate Track scrap and rework in real time so quality issues are caught at the machine, not at the customer.
Nulogy Smart Factory downtime analysis and Pareto chart showing top downtime causes ranked by impact
× Built-in Pareto chart Automatically ranks your top downtime causes by impact so your team knows where to focus first.
× Operator reason codes Operators log downtime reasons at the machine in seconds — no paper forms, no end-of-shift guessing.
Nulogy Smart Factory automated shift reporting showing production summary, downtime breakdown, and OEE by line
× Automated shift reports Reports are generated and emailed at end-of-shift, daily, or weekly — zero manual effort required.
× Real-time mobile alerts Instant push notifications when a machine goes down, a target is missed, or a threshold is breached.
Nulogy Smart Factory costing and throughput analysis showing labour costs, production rates, and shift performance
× Throughput trends Track output by shift, line, and product over time to identify your best-performing conditions.
× Labour & production costs Understand the true cost of each production run and where efficiency gains translate directly to savings.
× Hidden capacity Eliminating recurring short stops and changeover delays unlocks capacity without adding headcount.
Step 1 of 5 Production Overview Dashboard See your entire factory floor at a glance. Track OEE, production counts, and line performance in real time from one connected dashboard — no spreadsheets, no manual data entry.
See ROI in less than 3 months

Implementing Production Monitoring Software

Factory floor equipment ready for Nulogy Smart Factory connection

Connect Your Machines

Nulogy Smart Factory connects to your existing equipment and shop floor systems. No rip-and-replace required. Start capturing live production data from your lines in days, not months.

Operators capturing live production data on the shop floor using Nulogy Smart Factory

Capture Live Production Data

Operators log production events, downtime reasons, and job progress directly from the shop floor. Data flows automatically into a single connected platform — no spreadsheets, no manual entry.

Supervisor viewing OEE and line performance dashboard on factory floor monitor

See and Improve Performance

Supervisors and managers get instant visibility into OEE, downtime, throughput, and line performance across every shift, line, and site — so they can spot issues and act before they impact output.
Direct Connect PLC · Controller
Wireless Nodes & Sensors Photo Eye · Wireless Nodes
Automated Data Collection HMI · Tablet / PC / Mobile
Integrations ERP · BI · Database
In partnership with

Frequently Asked Questions

Work out the machine hours you expect to recover in a year (machines × shifts × days per week × 52 × minutes recovered per shift ÷ 60), multiply by your cost per machine hour, then compare that value with the yearly software cost: ROI = (value − cost) ÷ cost. Ten machines recovering 10 minutes a shift at $80 an hour return about $34,667 a year against $9,950, an ROI of 248%.

It uses $995 per machine per year for Nulogy Smart Factory and 52 working weeks a year. The minutes you recover and your cost per machine hour are your own estimates. Your actual quote depends on the Smart Factory tier and the size of your site.

It depends on how much downtime you can see today. Plants that track on paper usually underestimate downtime, because short stops and slow running never make it onto the log. Start with a conservative number, like 10 minutes per machine per shift, and adjust once you have real data. H&T Waterbury cut micro-stoppages by 71% and eliminated nine hours of weekly downtime with Smart Factory.

Include what it costs to run a machine, line, or cell for an hour: operator labor and the overhead assigned to that equipment. Leave out selling price and profit margin, which overstate the value of a recovered minute.

This calculator counts only recovered machine time, so treat the result as a floor. Smart Factory also tracks scrap, cycle time, and OEE in real time and replaces manual production reports. Most Smart Factory customers see a 10 to 20% OEE increase in their first year.

Trusted by Thousands of Users Every Day

Get Started with Nulogy

Reduce costs and improve performance with the manufacturing system built for you.

Services Dedicated to Your Success Built For Complex, Multi-Site Operations Personalized Walkthrough