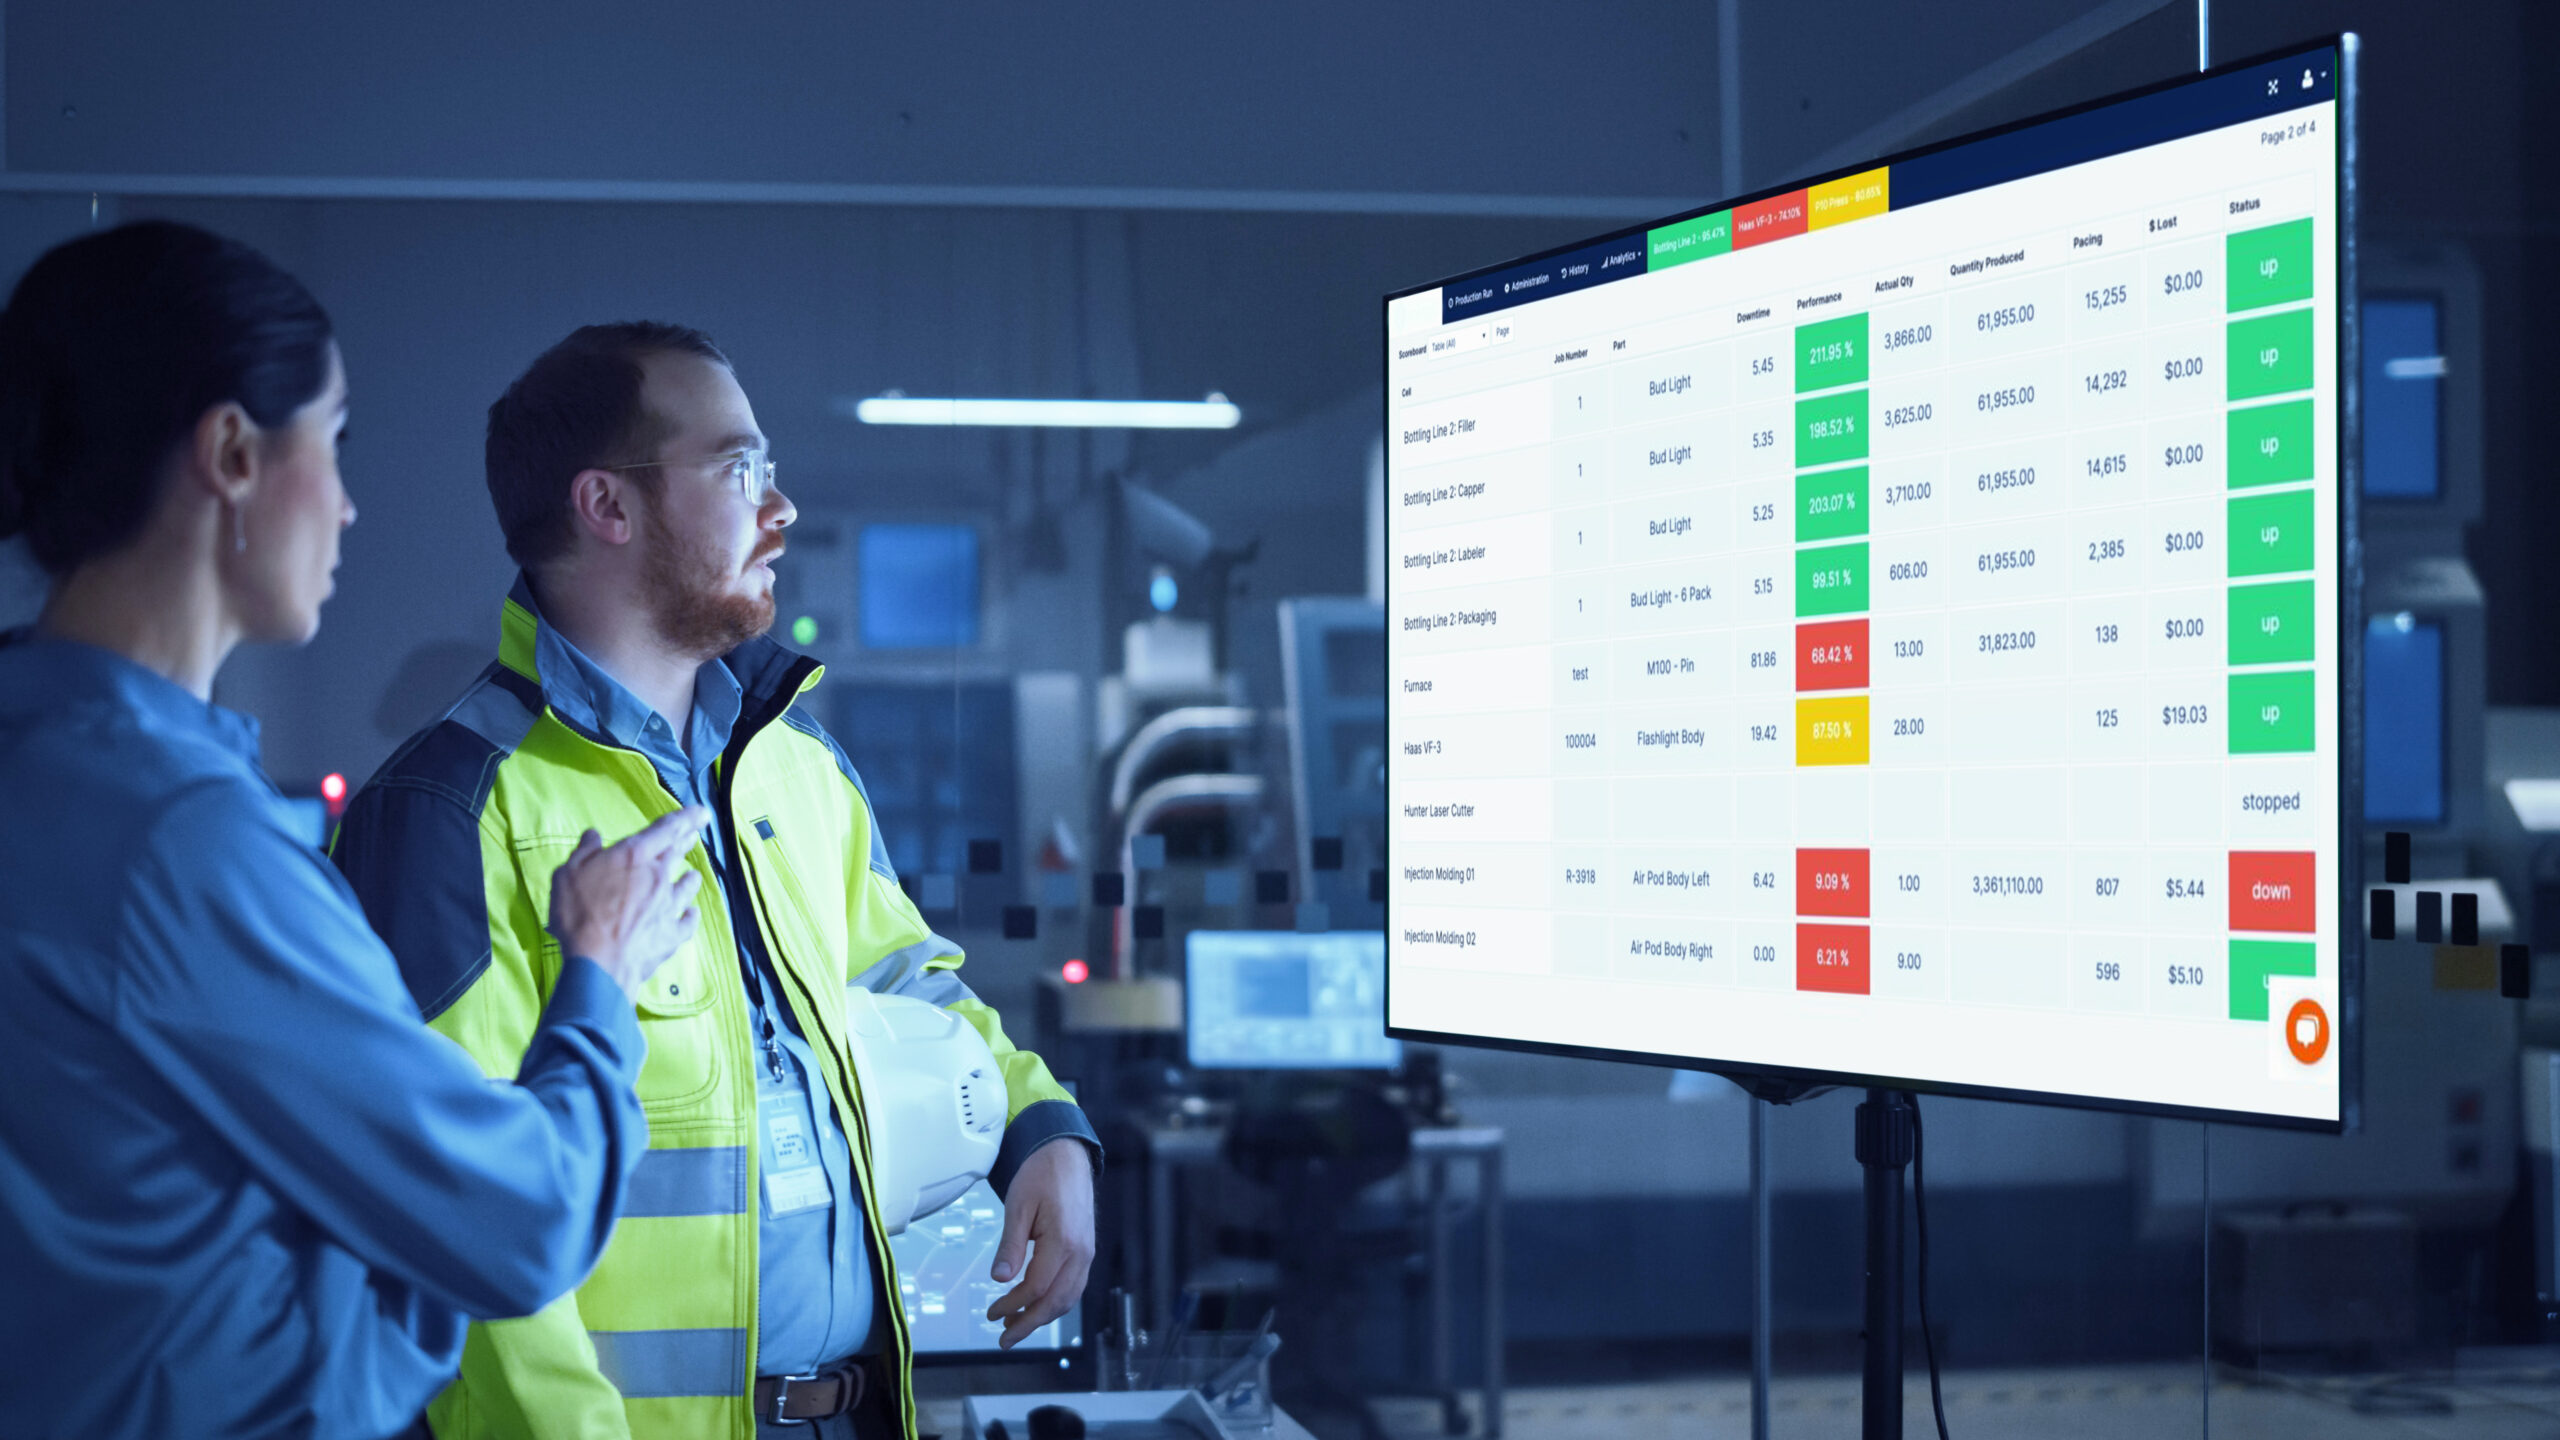
A single dashboard at the end of a line answers one question well: is this line on pace right now. It’s a good question, but it’s rarely the only one a plant manager, supervisor, and maintenance lead each need answered, and each of them is usually looking for something different from the same data.
One screen, three different jobs
An operator needs to know if the line is behind enough to call for help. A supervisor needs to know which of five lines needs attention first. A maintenance lead needs to know whether today’s stoppage is part of a pattern on a specific asset or a one-off. A single standalone andon display, built to show one line’s status to the people standing in front of it, was never designed to answer all three of those questions at once.
What a connected system adds
Nulogy Smart Factory keeps the same visual, glanceable scoreboard on the floor, but the underlying data is shared across every view: the operator’s screen, the supervisor’s plant-wide dashboard, and the maintenance team’s work order queue all draw from the same event stream. A shortstop that shows up as a few seconds of red on the floor screen is the same event a maintenance lead sees flagged against a specific asset’s MTBF an hour later.
Mobile visibility changes who can act
A dashboard mounted at the end of a line only reaches whoever is standing near it. Alerts that also reach a phone, with push notifications and escalation if no one responds, mean a supervisor two lines away or a maintenance lead off the floor can see and act on a stoppage the moment it happens, not whenever they next walk past that screen.
What plant-wide visibility looks like in practice
Instead of five separate screens showing five separate lines with no way to compare them, plant-wide visibility means a director of operations can see every line’s real-time OEE, downtime reason codes, and scrap trend in one place, then drill into any single line for the same detail an operator sees on the floor. That comparison is what turns “Line 3 is behind” into “Line 3 is behind because of the same changeover issue we saw on Line 1 last week.” This is the same kind of plant floor data visibility that separates a reporting tool from a real production monitoring system.
Where scoreboards and full visibility fit together
The floor-level scoreboard isn’t going away, and it shouldn’t. It’s still the fastest way for an operator to know the line needs attention right now. The question is whether that same data also reaches the people who need the plant-wide or root-cause view, or whether it stays trapped on one screen. See how micro-stops disappear from single-line displays if no one’s watching, and why the same event data should feed maintenance work orders, not just the floor screen.
A practical test for your current setup
A quick way to check whether your plant has plant-wide visibility or just a collection of single-line dashboards: ask your director of operations to name, without looking anything up, which line had the worst downtime yesterday and why. If that answer takes a phone call to the supervisor on that line, the data isn’t actually connected yet, it’s just displayed in more places.
A plant running five lines on five disconnected scoreboards is really running five separate reporting systems.
Explore how Smart Factory connects every line’s data into one view, or see what good production monitoring software looks like as a plant scales.