

Enter a shift’s numbers below to see your OEE and which factor is pulling it down. To raise OEE on the plant floor, you need real-time visibility into downtime, speed losses, and scrap as they happen. Nulogy Smart Factory, along with Nora, our built-in AI assistant, keeps you up to speed, so issues reach you before they cost a shift.
OEE (Overall Equipment Effectiveness) is the most used, and most misused, KPI in manufacturing. It measures how close a machine or line comes to running all the time it’s scheduled, at full speed, making only good parts. Accurate OEE starts with accurate cycle times (use our cycle time calculator here).
OEE (Overall Equipment Effectiveness) tells you how much of a machine’s planned production time actually turned into good parts. You pay operators and overhead whether the machine runs or not, so every point of OEE is more product from the same people and equipment. The alternative is buying more machines and hiring more people.
OEE rolls three kinds of loss into one number. Each factor answers a different question about the shift:
Because the three factors multiply, small losses stack up fast. Three factors at 90% give you an OEE of 72.9%, not 90%.
The OEE calculation uses five inputs from a single shift or production run: planned production time, downtime, total count, good count, and ideal cycle time. Work out each factor, then multiply them together.
Where does your number land? Use these benchmarks as a gut check:
Is 100% OEE the goal? No. 100% availability means no breaks, cleaning, maintenance, or changeovers, which isn’t realistic and often isn’t safe. 100% performance usually means the ideal cycle time is set too slow. A reported 100% OEE is almost always a data problem: a missing downtime tag, a misconfigured cycle time, or scrap counted somewhere else.
On its own, OEE is a high-level number. The value is in knowing why availability or performance sits where it does: which downtime reasons cost the most hours, and which products run slower than they should.
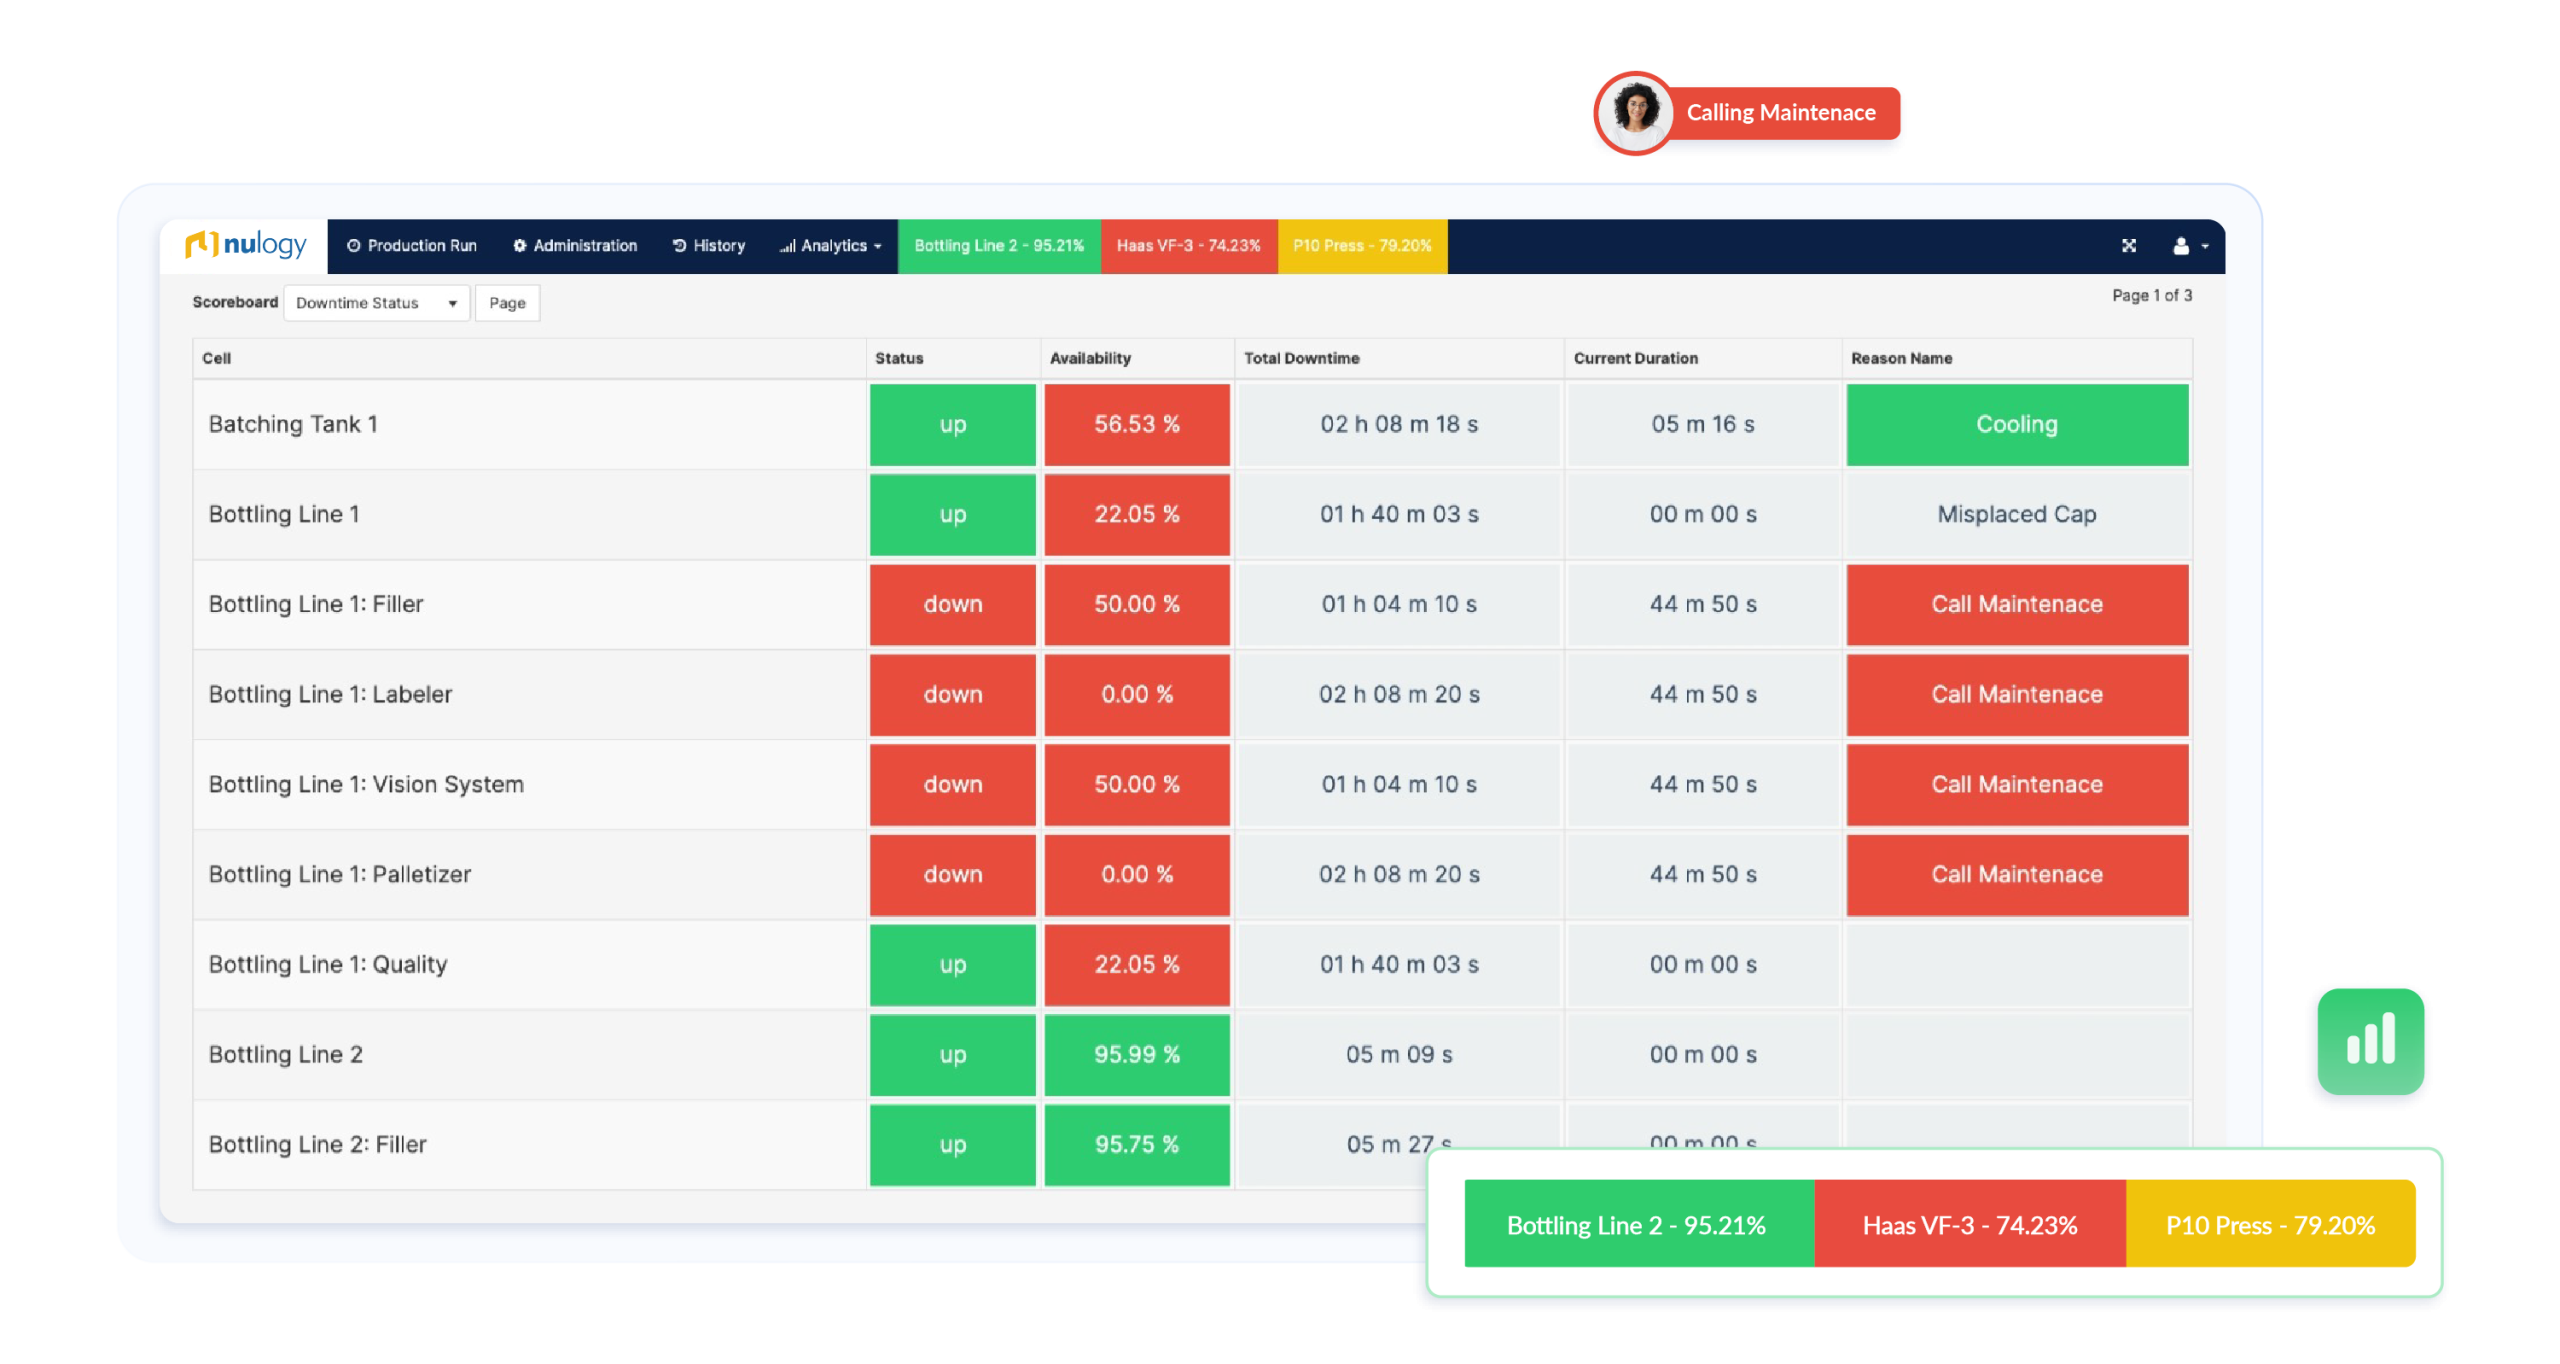
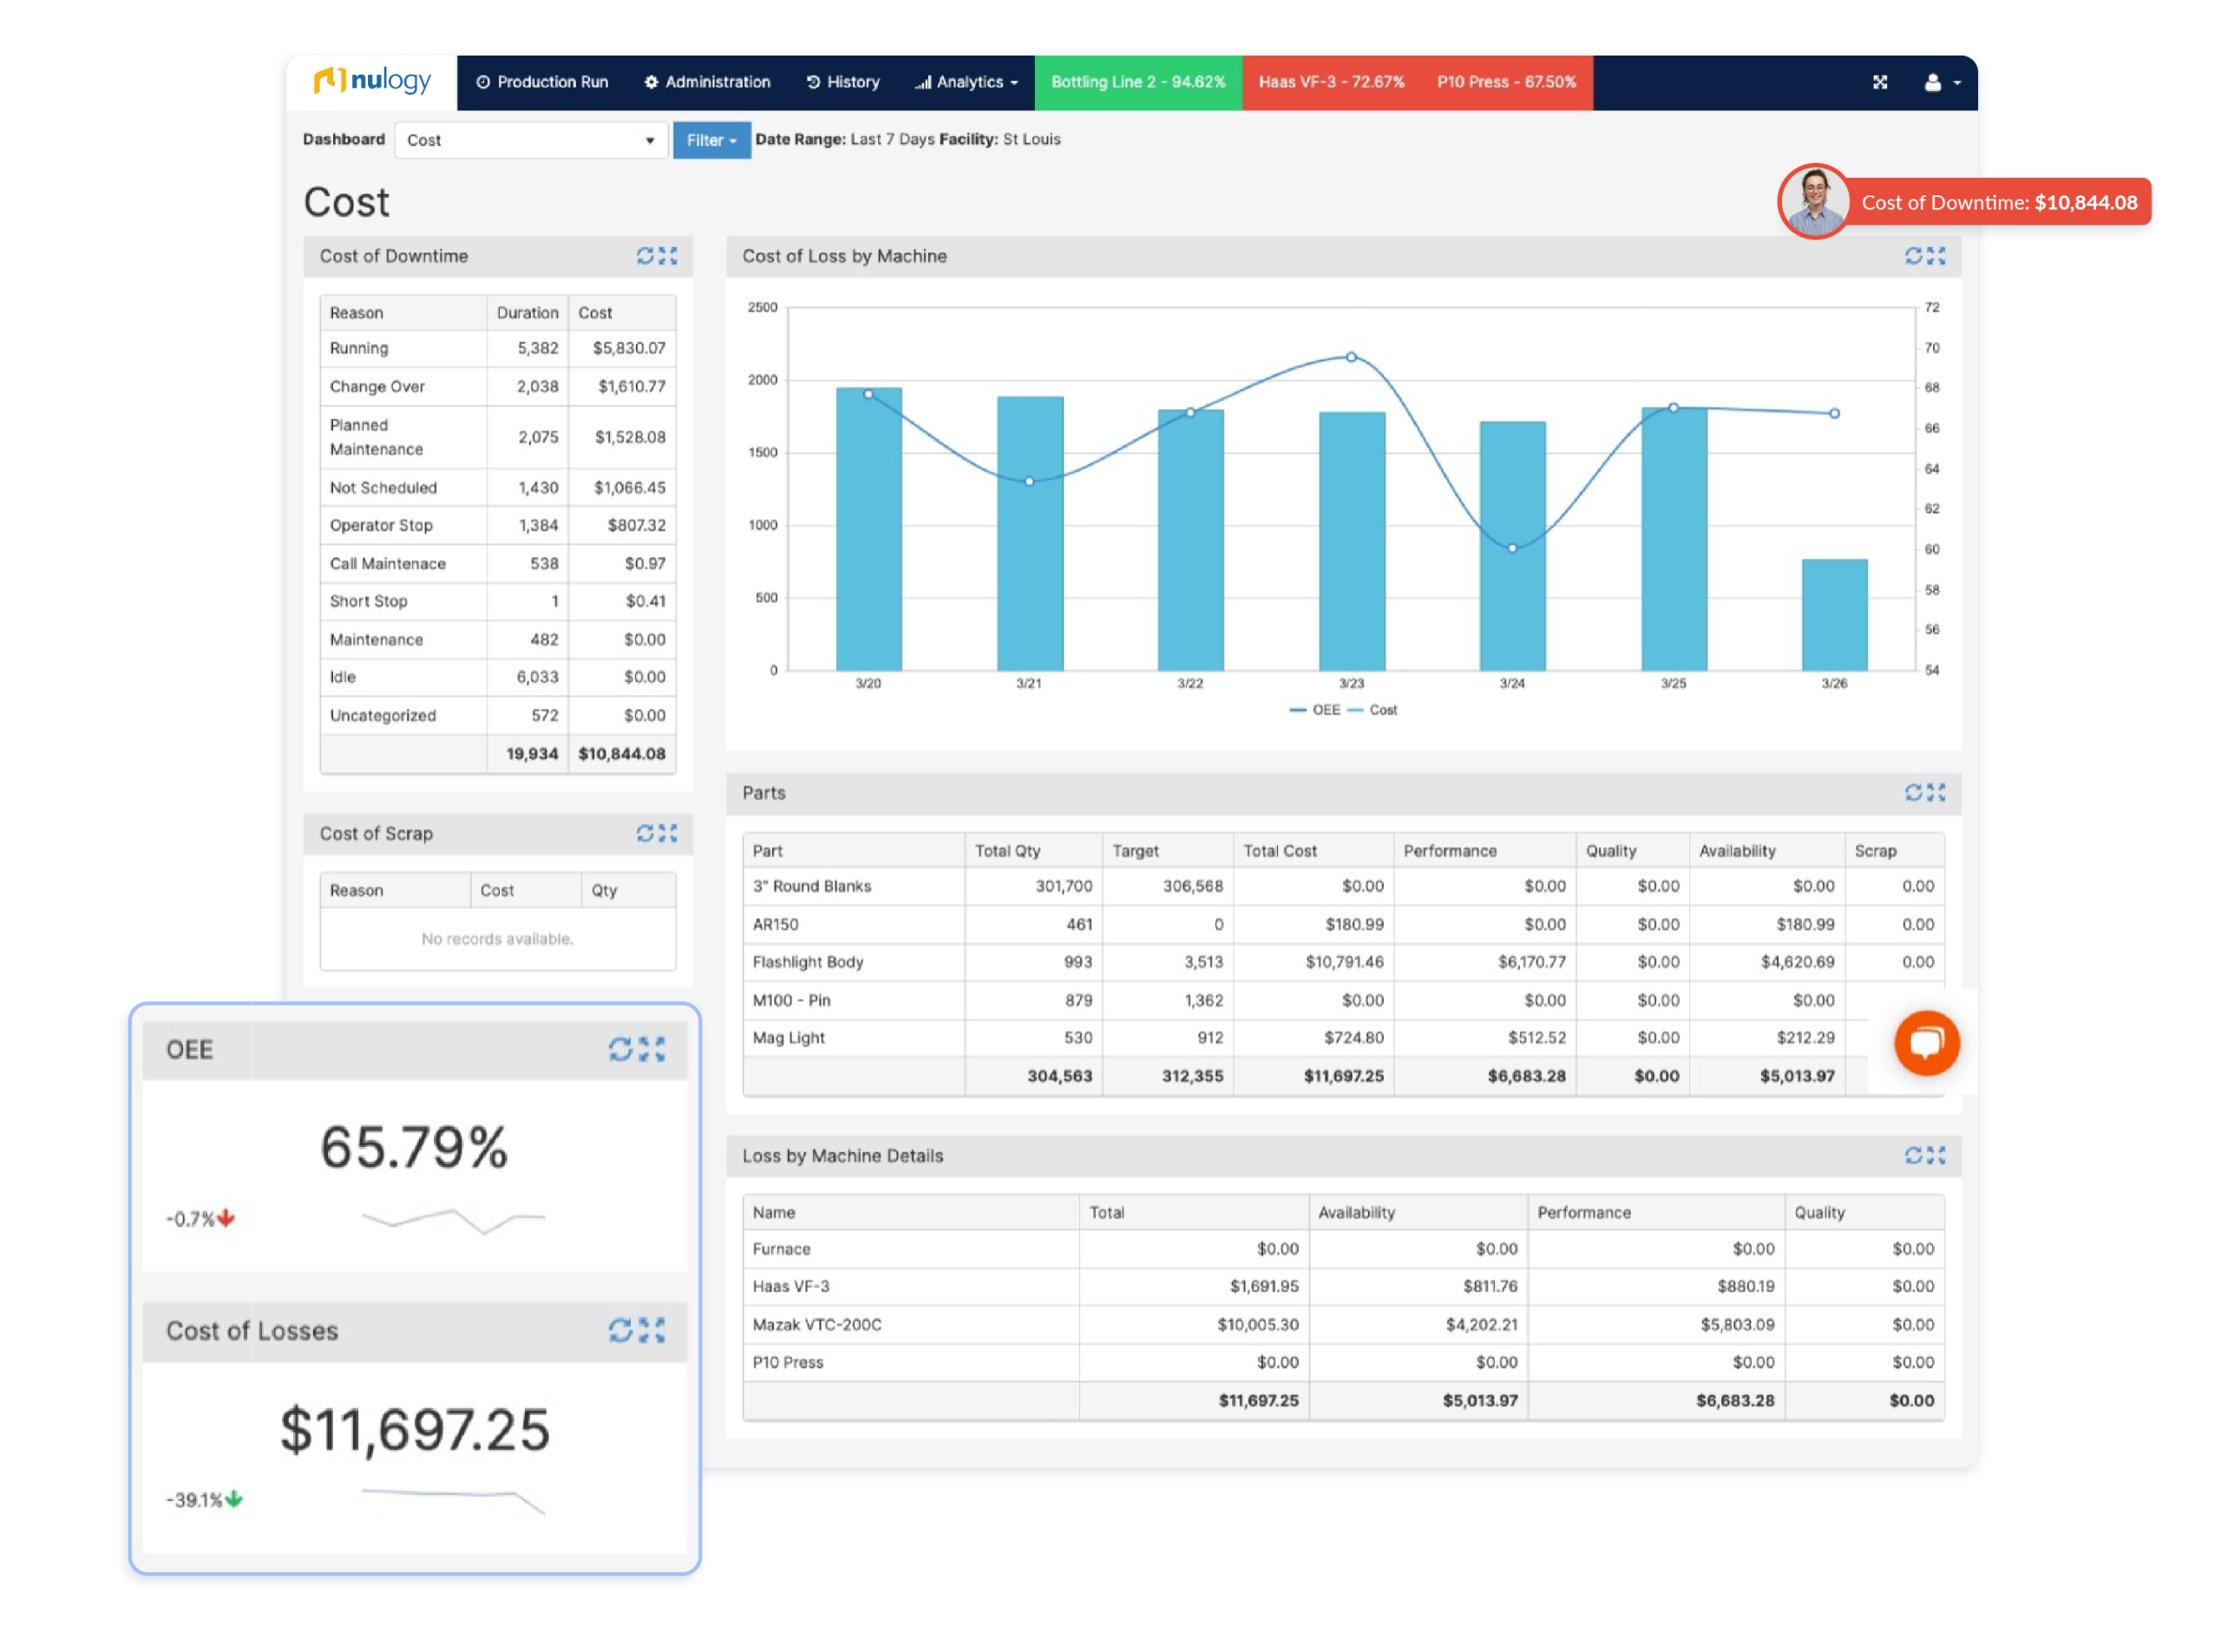
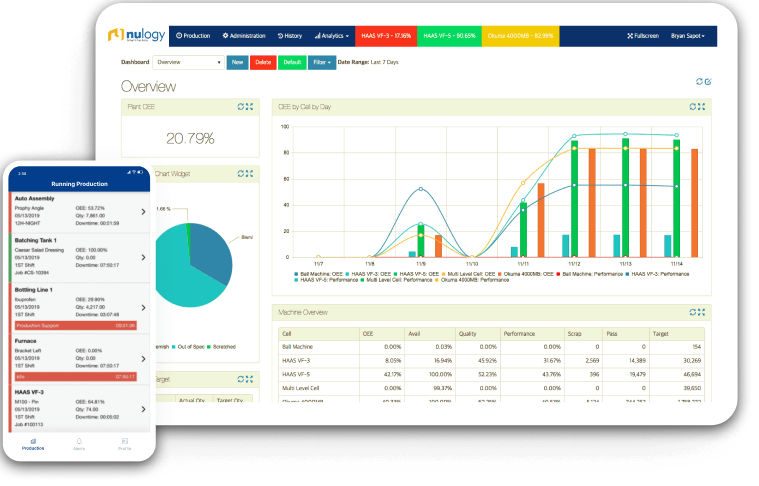
Stop waiting until the end of a shift — or the end of the week — to understand what happened on your shop floor. Nulogy Smart Factory gives manufacturers a live production monitoring system to track OEE, downtime, scrap, throughput, and line performance from a single connected dashboard.
View Production Monitoring DemoTrusted by leading manufacturers

If we could save fifteen minutes on machine time per operator, just by eliminating paperwork to be more efficient — we calculated we could save over $75,000. We have easily saved over $100,000 just in efficiency and paperwork alone.
Get the real-time visibility you need to understand what is happening across every line, shift, and site, without waiting for spreadsheets, manual updates, or Monday morning reports.
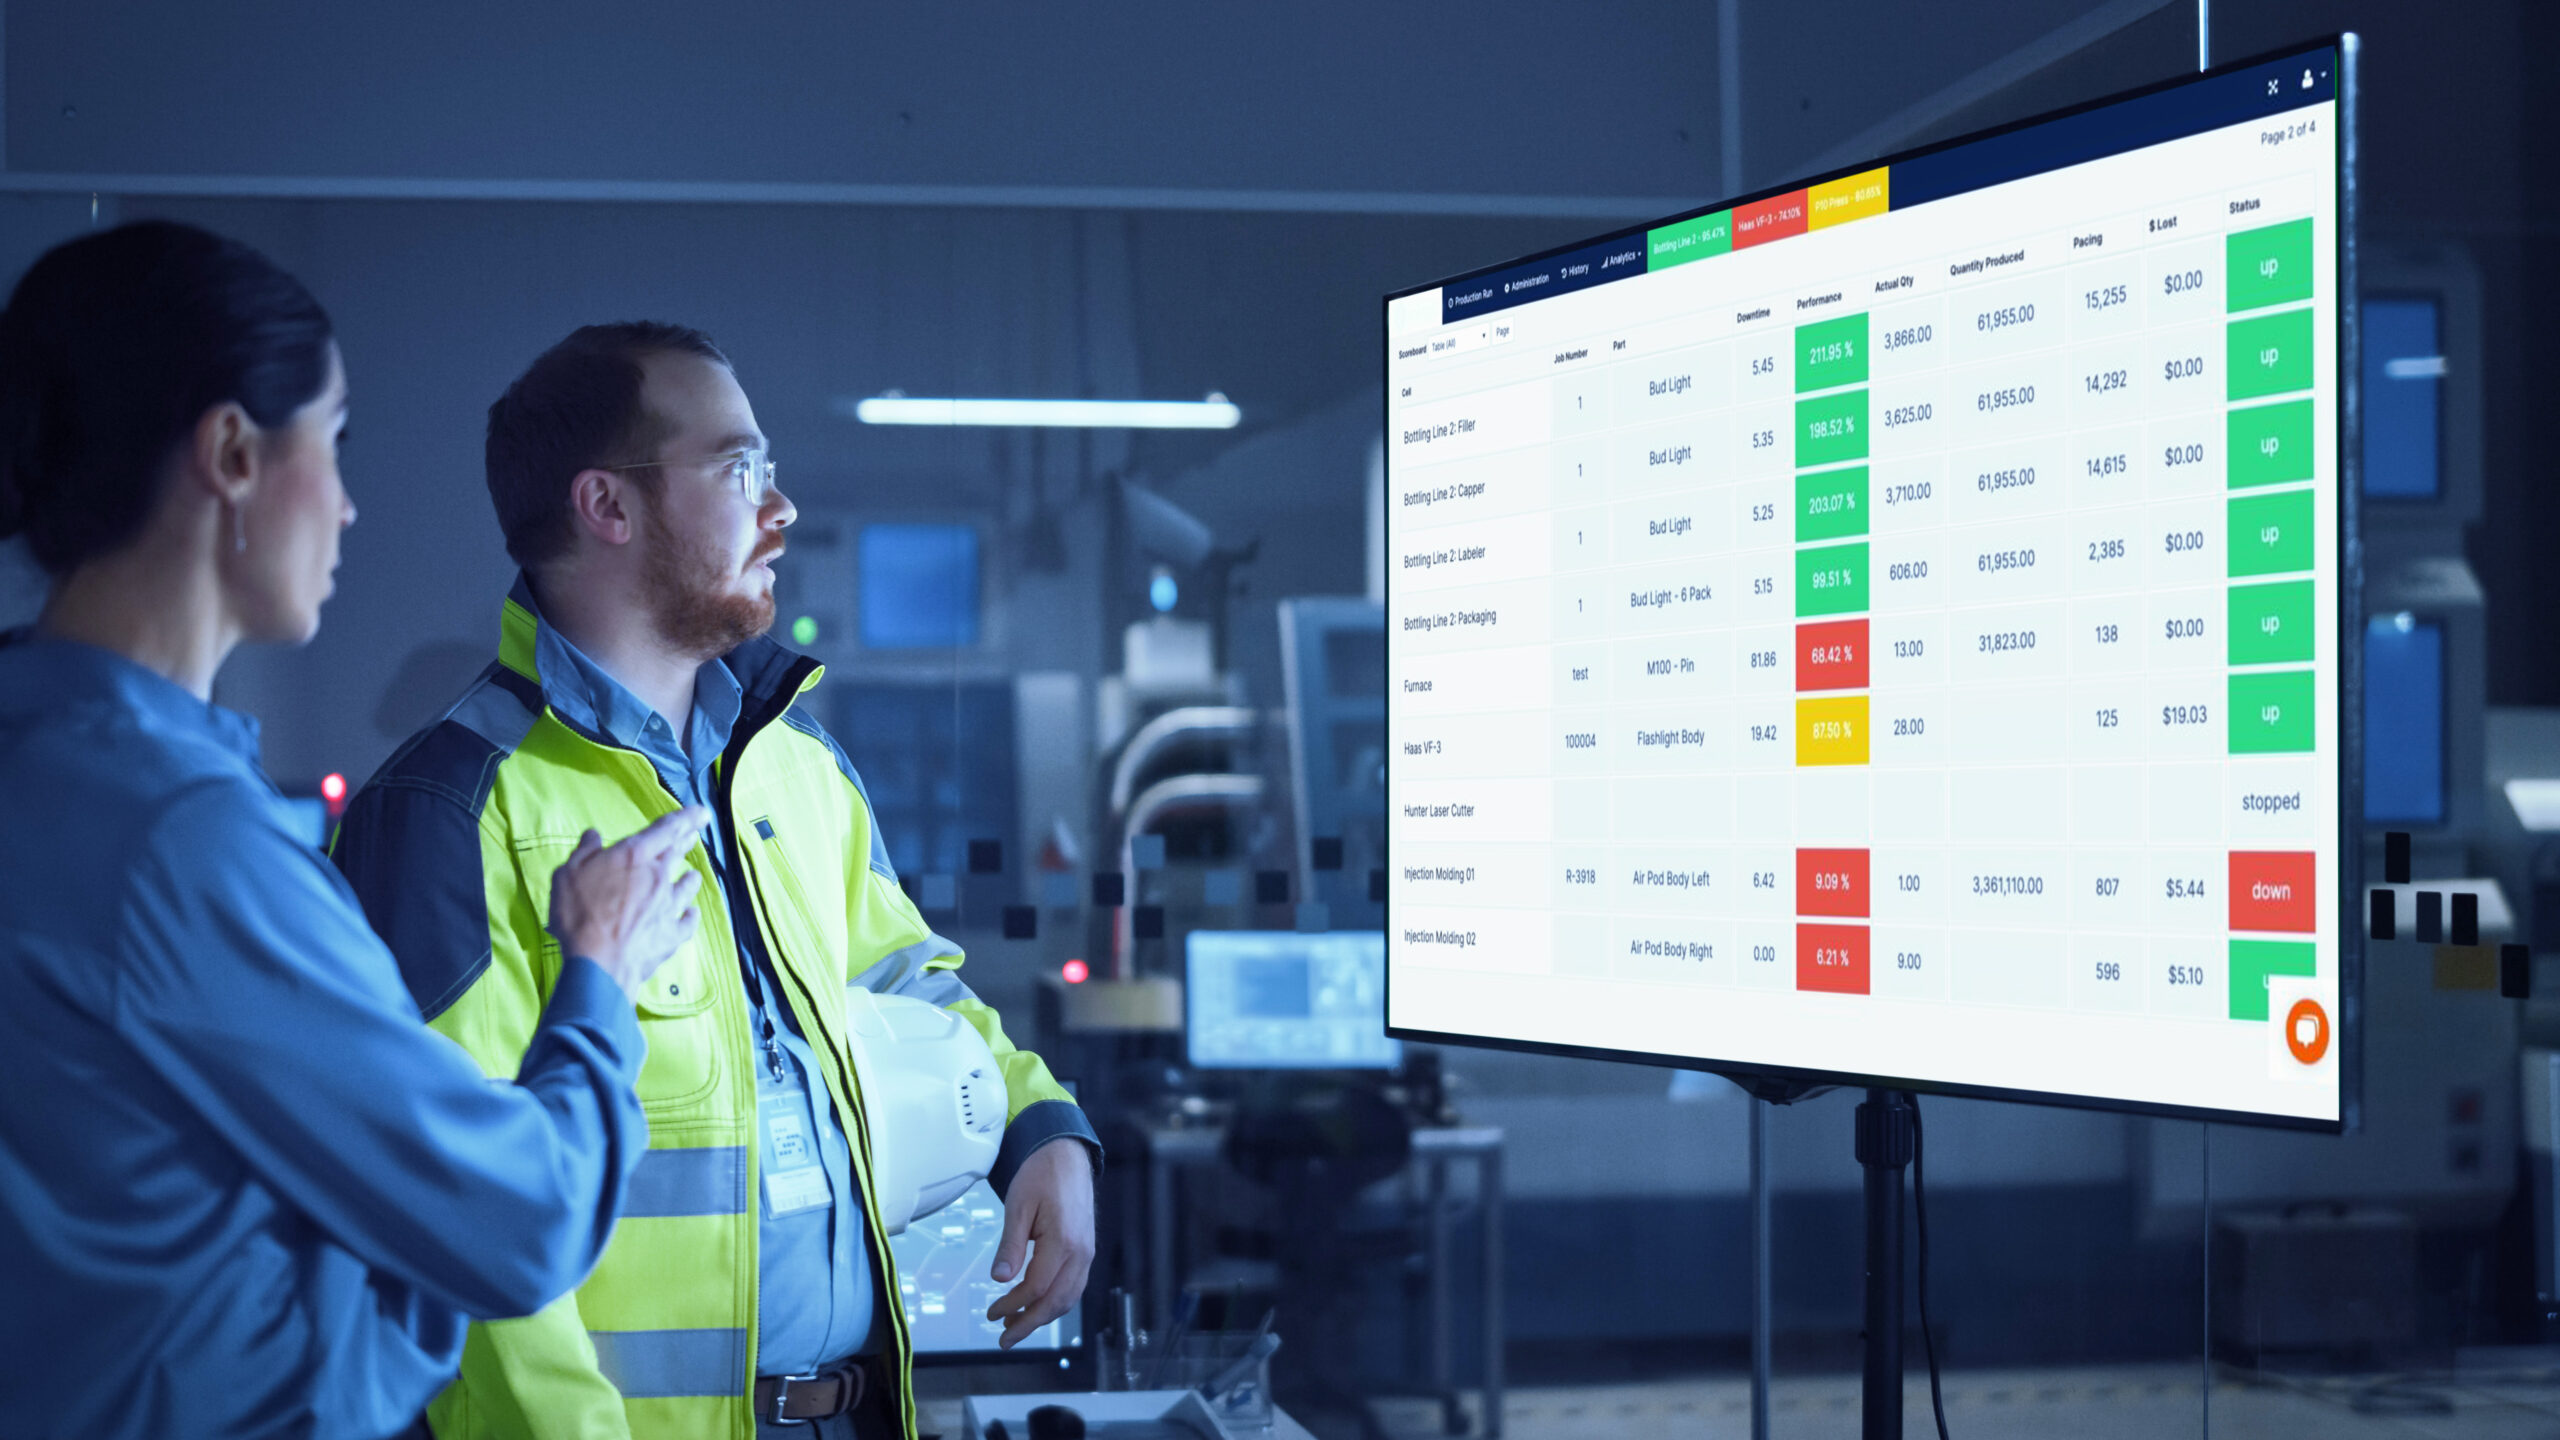
Replace chaotic manual processes with real-time connected visibility across every machine, line, and shift.
Drag the handle left to reveal Smart Factory
Part of Nulogy Intelligence
Nora is the manufacturing AI assistant built into Smart Factory and Maintenance. No dashboards to dig through. Ask in plain English and watch what comes back.
Tap a question to see Nora work
Your data stays yours. Nora never fabricates an answer, learns your line names and part numbers, and is never used to train external models.
View DemoEvery other AI assistant on the plant floor waits to be asked. Nora is built to flip that.
You notice the problem, then go ask. By then the line was already down.
Net weights are drifting toward the low limit. Nothing has failed yet. Want me to flag it?
“What gets tracked, gets improved.”

“Reduction in overtime was exactly what we were looking to do… and that’s exactly what we have achieved.”

“The real-time reporting at the manufacturing level is the biggest benefit.”

“Now that we have the transparency into the process, our OEE availability has increased significantly.”

Production Monitoring Customer Success Story
Oral Biotech used Nulogy Smart Factory to replace manual production reporting with real-time production monitoring. By capturing live shop floor data - including previously missed short stops - the team gained better visibility into performance issues, improved line efficiency, increased OEE from around 60% to close to 80%, and significantly reduced scrap and rework.
A production monitoring system helps manufacturers track, measure, and improve shop floor performance in real time.
Nulogy Smart Factory connects to your existing equipment — no rip-and-replace — and starts capturing live production data in days, not months. Track OEE, downtime, scrap, throughput, and line performance from a single connected dashboard across every shift, line, and site.
Nulogy Smart Factory connects to your existing equipment and shop floor systems. No rip-and-replace required. Start capturing live production data from your lines in days, not months.
Operators log production events, downtime reasons, and job progress directly from the shop floor. Data flows automatically into a single connected platform — no spreadsheets, no manual entry.
Supervisors and managers get instant visibility into OEE, downtime, throughput, and line performance across every shift, line, and site — so they can spot issues and act before they impact output.
OEE (Overall Equipment Effectiveness) measures how much of a machine’s planned production time turns into good parts. It multiplies three factors: Availability (did it run when scheduled), Performance (did it run at speed), and Quality (were the parts good). A line at 80% availability, 87.5% performance, and 97% quality has an OEE of 68%.
85% is the widely cited world-class benchmark, and most plants run between 50% and 65%. If someone reports more than 85% without a production monitoring system, be skeptical. Manual tracking tends to miss short stops and slow running, which flatters the number.
It’s almost always a data issue, not a great shift. The usual causes are an ideal cycle time set too slow (which pushes performance over 100%), downtime that never got recorded, or scrap counted somewhere else. Check those inputs before celebrating.
Smart Factory records every quantity, scrap, and downtime event against the machine or line, pulled straight from a PLC connection, a Banner wireless sensor, or an Advantech gateway. Availability is uptime over scheduled time. Performance is actual quantity over possible parts at plan cycle time, counted only while the machine is up. Quality is good quantity over good plus scrap. OEE is strictly Availability × Performance × Quality, and for a full line it reflects the final station, where finished goods come out.
Start with the factor that’s lowest. For most plants that’s availability, so tag every stop with a reason, rank the reasons by lost hours, and work the top few. Then look at performance: compare actual cycle time with ideal cycle time by product to find lines that run slow without ever stopping. Most Smart Factory customers see a 10 to 20% OEE increase in their first year once these losses become visible.
Reduce costs and improve performance with the manufacturing system built for you.