OEE breaks down into three numbers: availability, performance, and quality. Multiply them together and you get a single score that’s supposed to represent how well a line is really running. Most plants that calculate OEE focus on the big, visible losses, a two-hour breakdown, a bad batch of scrap, and miss the loss doing the most damage: dozens of shortstops a shift, each one too small to notice on its own.
The math that hides shortstops
Availability measures how much of scheduled time the line was actually running. Performance measures how close the line ran to its rated speed while it was running. A shortstop, a 15 or 30-second stop that gets absorbed into the shift without being logged, doesn’t always show up as an availability loss if no one records it as downtime. Instead it often gets buried inside the performance number, showing up as “the line ran slower than expected” rather than “the line stopped 40 times.” See the full breakdown of OEE, OPE, and TEEP and which to calculate.
Why that matters for where you focus improvement effort
A performance loss that’s actually 40 hidden shortstops needs a completely different fix than a genuinely slow-running line. Speeding up a line that isn’t actually slow, it’s just stopping constantly, wastes engineering time solving the wrong problem. The only way to tell the difference is catching each stop as its own event, classified by reason and duration, rather than letting it dissolve into an aggregate performance number.
What real-time shortstop detection changes
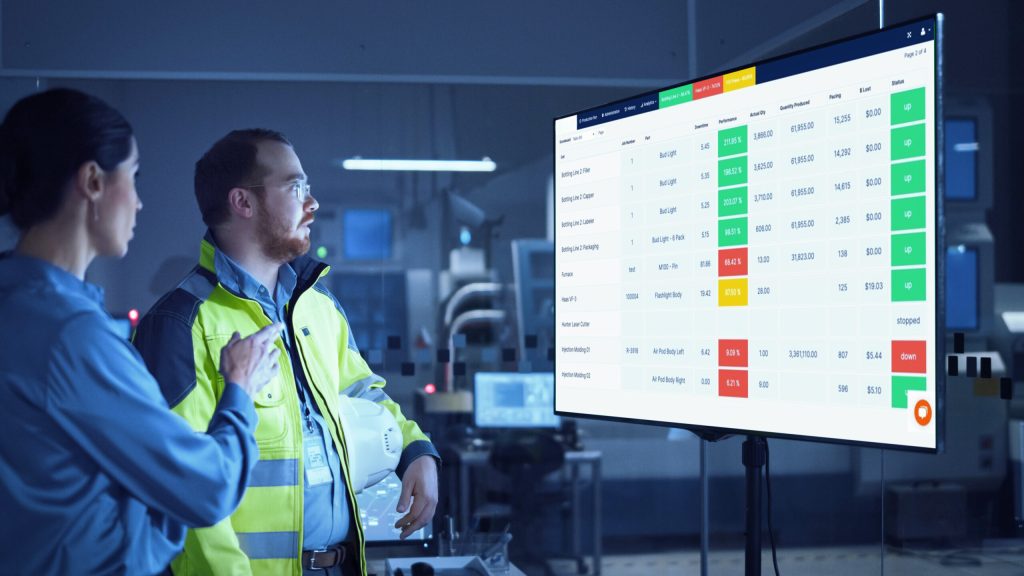
Nulogy Smart Factory uses server-side calculations that flag any interruption in seconds-long intervals, independent of whether an operator logs it. Each flagged stop gets a reason code and a duration, which means a performance loss that used to be a mystery becomes a specific, countable list: 22 stops for a jam on Station 3, 14 stops waiting on an upstream feed, 6 stops for a manual adjustment. Read more on what causes micro-stops most plants never fully see.
Turning the list into an action
Once shortstops are visible as discrete events, the fix usually isn’t complicated. The most frequent reason code on the highest-volume line is almost always worth a focused look: a guide rail that needs adjustment, a changeover step that could be reordered, a sensor that needs recalibrating. Nora can surface that ranked list directly, so a supervisor doesn’t have to build the report by hand before starting the conversation about what to fix first. See how Nora answers downtime questions in plain language.
Connecting shortstops to maintenance, not just reporting
A shortstop pattern concentrated on one asset is often an early signal, not just a productivity problem. Maintenance built into Smart Factory can turn a recurring shortstop pattern into a work order before the same asset causes a full unplanned stop, closing the loop between what the shortstop data shows and what the maintenance team actually does about it. See how reactive, preventive, and predictive maintenance fit together.
Why this rarely shows up in a monthly OEE trend line
A monthly OEE trend can look flat even while shortstops are getting worse, because performance losses at that scale move slowly and get smoothed out over weeks. Catching the shift early means looking at shortstop counts by reason code week over week, not just the single OEE number at the end of the month.
If your OEE has plateaued and the big losses have already been addressed, shortstops are very likely where the remaining points are hiding.
See how real-time OEE tracking surfaces shortstop data, or read about why one dashboard isn’t enough to catch every stop across multiple lines.
Ready to see Nulogy in action? Book a demo with our friendly, knowledgable solution team today.