Welcome, everyone. I am Michelle Seminaro, the executive director for F4SS – Foundation for Supply Chain Solutions.
And today, you’ve joined us for a conversation with Brian Sapot, who is going to talk to us about boosting OEE with production monitoring and working with Smart Factory.
So just a couple of things, housekeeping things. We are recording this session, and it will be available on our website.
We ask that this be an interactive participation, so more of a conversation than, a lecture series. So we hope that the conversation is where we’ll get a lot of our learnings together as well.
I will monitor the chats. So, if you want to use the chat instead, or you can just jump in and ask your questions as the time comes.
So let me introduce you to Bryan. Bryan is the VP of Smart Factory. He’s responsible for the development and growth of Nulogy solutions for manufacturing environments.
He has over twenty five years of manufacturing technical experience and has become a prominent voice on harnessing data to drive continuous improvement and operational excellence.
His passion for lean manufacturing principles has made him a sought after speaker on optimizing plant performance.
Bryan’s unique blend of technical savvy inspires manufacturers to capitalize on industry four point o capabilities.
So I’m now gonna turn this over to Bryan. OK, Bryan.
Thanks, Michelle. I appreciate it. It’s always strange to hear that bio read before I speak.
So, as Michelle said, I come to this from a manufacturing perspective, and I know F4SS is focused on supply chain, which includes manufacturing to a certain extent. But, some of it, I think, applies broadly to distribution and things like that as well. So, with that, let’s get started.
The kind of the core the core idea that we’re gonna talk about today is a very obvious one, which is manufacturing is really hard. Right? Every day is a different challenge inside of a plant. Sometimes you have problems with people.
Sometimes you have problems with equipment. Sometimes you have problems with materials. Sometimes you have all the problems at the same time. And most companies are making decisions with limited information based on, you know, gut feel or or walking around the plant, which can get you so far, but maybe not where you wanna be.
And they’re managing in the rearview mirror. And, really, the reason why that’s happening is because the most popular production monitoring and reporting platform in the world is Excel. Right?
Most people, you know, it it it’s a very easy way to get started. It’s very low cost. Like, you everybody has Excel already, so you put together a spreadsheet, and you have the folks on the floor start entering data into it. And it could work, until you get to a certain size.
And there’s problems with it. Right? If Excel is always error prone, like, you can mess up the formulas. Somebody can edit it when they’re not supposed to.
Also, the data entry in these things are typically subjective. So, like, one of the things we’ll talk about today is downtime and how that really affects throughput in a plant in your your performance.
My idea of a long downtime could be different from Michelle’s or Bryan’s or Christine’s on the call. Right? And, also, I’m not watching the clock seeing, you know, was it really five minutes or was it six minutes? I’m just gonna write down five.
So it becomes, subjective.
And, also, one of the bigger problems is it’s hard to do long term analysis in Excel. So if, for example, you’re in a quarterly meeting, right, with the production team and maybe, exacts from from corporate, and you’re discussing our biggest downtimes for the month and how we reduce them.
And they wanna know the specific biggest ones, like on what date and what happened and all of that. And it’s to to find that in Excel is gonna be tough. You have to go all the way back to the source sheets. And so, you need something that’s a little bit easier to do than that.
And these production monitoring systems are really decide really designed to do that. And they’re designed to help you proactively manage your operations, stopping these firefights, provide that better data for more accurate decision making, and then really understand capacity so that you can plan for the future. Right? Like, if we close that five million dollar deal, do we have the capacity to take that, or do we have to hire more people?
Do we have to buy more equipment?
Maybe even build a new building.
And, really, what we’re gonna talk about today is less about software and more about what is OEE, how do we improve it, and systems and processes to help you, run the plant better. And it’s kind of agnostic from a software perspective, but Nulogy Smart Factory does all this stuff too. So Michelle did a pretty good job on my introduction. I think, you know, based on my my background, the only other thing I’ll add is I I live in Northwest Montana, and I I like to ski, bike raft. I like out outdoorsy stuff. In addition to that, I love working in manufacturing technology, like, where tech and and the physical world come together is always really exciting to me.
So what I wanna start off with first and and like Michelle said, this can be interactive, so ask questions as we as we go through this. But I wanna start off with what is OEE? In the manufacturing world, most people know what this is. When you get out into distribution and supply chain broadly, you use something similar, but it’s a different term. So OEE stands for overall equipment effectiveness.
Basically, what it means is like a single number to tell me if I had a good day or a bad day on a on a line, in a plant, in a department, etcetera.
And you can really boil it down to a simple formula of how much good product did I produce divided by how much did I plan to produce. Right?
So pretty simple. But it’s broken down into three different metrics that are multiplied together to get OEE. So one of them is availability, and it’s simply, did I run when I was supposed to? So let’s say I had an eight hour shift. Let’s say an hour of it was, you know, like, breaks and lunch and start up shutdown, and I should have run seven hours of the eight hour shift. How much of that time did I actually run?
And then performance. So did I run at my planned cycle time or my planned run rate? So if I can produce a hundred parts per hour, how close to that did I get? And it’s, you know, expressed in a in a percentage just like availability.
And then finally, quality. So it’s good items produced divided by total items produced. So if I produced a a hundred total items and ninety nine of them were good, I had ninety nine percent, quality.
And so these three are multiplied together to get OEE.
And it’s a good metric. We’ll talk about that in a second, but it’s a good metric because you have one number to tell you if you’re having a good day or a bad day.
It’s a bad metric, though, because it could hide some of the some of the, variability in what’s going on on the floor. Like, these numbers could all switch around. For example, I could have ninety nine percent availability, but eighty six percent quality, and I still get seventy one percent OEE. Eighty six percent quality is really bad. Right? So, it can hide some things there, but we’ll we’ll talk about how to handle that as well.
And you could also think of this as another metric, which is throughput. And you can really simplify the OEE formula down into just this, total good quantities produced divided by planned quantity produced over a certain time frame.
And it’s just throughput. So, like, if we should be able to make a hundred parts a day or ship a hundred products per day and we only did eighty, right, so you have eighty percent OEE. So it can be a very simple formula. The nice part about blowing it out is it tells you where your problems are. So, you know, you can see if you have low availability, you can start digging into downtime and and where are my problems.
So why does OEE matter?
It’s a very simple way to measure, like I said, effectiveness, which is effectively good day, bad day. Right?
And it can be common across different lines, different equipment, different departments, even different plants. In a in a larger company, you can actually use it to compare plants against each other as long as it’s calculated the same way at each location, even if they’re making different stuff with different processes, which is which is nice. So everybody’s talking the same language. Everybody’s measured in the same way. And then the other thing that I mentioned before is because it’s broken out into three metrics.
When, you know, availability is low, you can look at, okay, why? And they’ll typically be downtime reasons associated with that to help you figure out why. What what were our biggest downtimes that day or that week that caused availability to be low, and then you can go solve them. And we’ll talk about that process, a little later in the in the presentation.
And so when you start to dig into OEE, what you will find is that some person, I think at Ford, decided in the nineties that eighty five percent OEE is world class, which is fine. But is that achievable?
I’ll tell you it’s very, very hard, to achieve an OEE of eighty five percent or greater. And here’s just an example calculation. So oops.
Let’s say our availability is at ninety percent, which is really good. We’re only we’re running ninety percent of the available time that we have. We’re running at ninety five percent performance, and almost all of our parts are good. Multiply these three together, it’s eighty five percent. Really hard to achieve. And if you you start to break this down in terms of, like, real minutes, right, it it or even real hours, you know, It’s just not a lot of time. Like, if you had a just to make the math easy from an availability perspective, if, you had a ten hour shift, you’re you’re only losing an hour and a ten hour shift, to changeovers, to downtime, to material issues, like all the different things that happen, which is not very much.
So it’s very hard to achieve.
And what’s interesting is that you can judge even if you don’t track OEE today, you can judge where you are based on how you collect and, process and analyze data.
So on the low end, like, the sub forty percent OEE, typically, you know where your problems are. Like, you can walk out in the plant and just see them.
But these companies are usually just doing counts at the end of a shift. They’re writing down downtimes at the end of a shift, and so you’re really relying on the operator’s memory for what happened.
And then it’s typically going into Excel or maybe it’s just paper that goes into a a filing cabinet.
Up from that, fifty percent, you’re doing counts hourly. So maybe some of you have seen if you’ve been in a plant, there’s a whiteboard where people will write down hour by hour what their target is and, how how close they got to it and the reasons why they didn’t hit it.
That’ll typically also go into Excel and and look at it, and you have the typical Excel problems with that. The next level up is I have a system. Right? But everything in the system is manual. So maybe I have an ERP system where I’m putting in counts. I’m recording my biggest downtimes, and I have the ability to analyze that stuff over a longer period. You’re usually in the sixties.
This is where most manufacturers, like, who have a system, they’re gonna be in this kinda fifty five to sixty five range. Right?
To get into the eighties, you need an automated system because now you’re trying to track down minutes, right, as we were looking at before. Like, just mic I mean, we’re we’re talking about, you know, max an hour in a shift, and you need to understand, like, where this stuff is coming from to be able to fix it. And you need consistent measurement automatically to be able to do that. You can’t rely on subjective data entry form, operators.
So looks like somebody’s got a question.
They do.
So Tom has asked, we can all agree a hundred percent uptime is a good aspiration as is a hundred percent quality, but speed and rate is more subjective.
Do we use actual historical data, design speed of the asset, etcetera? How do you recommend companies set that target?
So it’s it’s, it’s a really good question, Tom, and it it depends on the company.
So we have found, like, in some places, when the machines run, the cycle times are spot on every single time. Right? Like, it runs at eighty three parts per minute. And when it’s on, it’s running at eighty three parts per minute, right, the whole time. And downtime is actually a bigger a bigger problem. But then in other places, speed is a big variability because you have to have people touching product or making changes or adjustments and things like that. So I think you have to match it to your environment.
What what we suggest and, actually, in in our product, Nulogy Smart Factory, you can set a planned rate, which is what you think the machine should do given staffing and your historical information just like you you asked. And then you can also have, an ideal rate, which is like the plate speed, the design speed of the asset that you’re talking about. You can measure both.
So, like, you can the the operators and people on the floor can base everything off of the planned time, right, so that they’re not trying to hit some unachievable target.
They can base all the their visuals and metrics and everything off of the plan target, but then, like, engineering and maintenance or even maybe what you report back to the machine builder can be based on the ideal.
We actually just to tell a story about that, we we had a company that was in the the marijuana business, and they had a machine that would do pre rolled joints.
And it’s still weird to talk about this, like, in on webinars and stuff. But, anyway, the plate speed of this thing was, like, thirty percent higher than they could ever run it. And we actually added the ideal cycle time to the product to be able to track that so they could go back to the machine vendor and be like, look. We can never ever hit this speed.
You guys guaranteed us this. And so, you know, it helped get the vendor back in there to improve the performance of of that machine and fix a lot of the engineering issues associated with it. So I I recommend setting a realistic planned target, something that people can hit, motivates them, feels good. You don’t want it to show red all the time.
But then behind the scenes, you can track the ideal you’re trying to get to.
So, hopefully, that answers that, Tom. It’s a good question.
Okay. So that’s, like, high level. What is OEE? How does it how does it fit?
So let’s talk about how how would we do this? So if we’re we were gonna implement a system, like, Nulogy Smart Factory, how should we do this? First, I’m gonna start with a a bit of a case study from, one of our customers, and this is a company called Elsa. They’re they’re based in Indiana. They make parts for Subaru, for the most part. So they make exhaust systems, gas tanks, different things like that.
And they’re a very good case study in this idea of, which we’ll talk about in a second, start simple, think big, move fast. They have big facility, hundred and ten or hundred and twenty different lines, eight hundred pieces of equipment.
And they started years ago with us on a single piece of equipment, and they were actually tested us against a competitor.
And what I liked about this was and this Elsa could be the case study for literally everything I’m gonna talk about for the rest of the presentation. But all they were measuring was end of line counts. Right? We just wanna we wanna see the throughput of the lines. We want it to be automatic. And because we’re measuring the end of line counts automatically, we get accurate downtimes and and things like that.
And they’ve grown with us, I guess, over the course of the last four years. They started with, hey. Let’s just do end of line counts. They rolled it out to another department. I think it was about fifty machines, then they added twenty more, twenty more, twenty more. Now we’re up to about a hundred and twenty different lines.
And they were able to reduce their sorry. Increase their OEE by twenty percent. They reduced their short stops from a total of sixty sixty minutes a shift to less than five, all by, like, starting very small and focusing, on a very specific, you know, area and then moving on and moving on and moving on. So the process that they used and the process that we teach is this idea to implement the software is this idea of start simple, think big, move fast.
So it’s a process to help ensure improvement and adoption of solutions like this. You want to you’re you’re starting simple to limit disruption and change, and these things are a journey. They’re not a destination. So, like, if any of you have ever implemented, like, a warehouse management system or an ERP system, those things all go live at once.
Right? All functionality at the same time. It’s called the big bang. Well, with the production monitoring system, you can implement little pieces of it over time and then build on that momentum and quick wins and then iterate.
Right? It’s a much easier process with a lot less disruption.
So let’s break down each each one of those. Start simple.
So it it means limit the change.
It doesn’t really need to be a small number of machines even though that’s where Elsa started. I mean, they started with one to prove it out, and then they quickly jumped, I think, to forty five or fifty.
And you wanna be small enough to guarantee success, but big enough to matter. So what that means is is if if if you test one of these systems on a single line or a single piece of equipment for a long period of time, and I saw I put this down in the caution, people will typically revert to the system they used before because it’s easier. Right? Change is hard for everybody.
Right? They don’t like it. Like, habits are hard to change. And so what we suggest is if you wanna start small, you should do an entire process, like an entire line from beginning to end, or what’s even better is like a a department so that you don’t have operators, supervisors, management using two different systems to manage the floor.
Because, again, even, like, up and down the organization, doesn’t matter who you are, change is hard, and you’re gonna revert to the to the old system when things get tough because it’s just easier.
Right? So you wanna start simple, so you limit the change. Right? But also, you know, big enough big enough to make a difference.
And then you wanna think big. So the Elsa thought, you know, very big ahead of time. Like, yes. We’re just gonna track this single this single data point, but then we know that we basically wanna move to a digital factory at the end of the day. And so you wanna know, like, where what are the next steps when we once we start to see success with the the system.
Right? So define that North Star. Where do we wanna go? Maybe it is you wanna try to reach eighty five percent OEE, and you’re in the sixties right now. And you can kinda define the steps that you think you need to take to be able to get there.
What’s interesting, though, is that be flexible about the the North Star because based on what you learn and the data that you get, it may change. Because we found over and over again that the prop the problems you think you have are actually not your biggest problems after you implement the system.
We had one customer, another auto parts supplier outside of Toronto, that thought they had a a maintenance problem because their their presses were going down all the time, and the the operators were writing down it was a maintenance issue. This is kind of a weird one. But what it turned out to be after they implemented the software is they didn’t have enough fork truck drivers to deliver raw material and molds to the presses on time. And just to be easy, everybody wrote them down as maintenance issues while they were waiting for stuff. I guess they don’t like maintenance, and they like the fork truck drivers, and that’s why they did it. But it was hours of downtime every day because of of this, and it’s a simple fix. You just need another fork truck driver and another fork truck.
Right? So it’s pretty amazing what you learn, and it’s gonna change change what you do, but you need to have an understanding of where you’re going.
And then the final part of this is you wanna move fast. So you’re starting small to limit change. You’re starting you’re starting simple to, make sure that you’re gonna be successful with what it is. And once you get those quick wins, use that momentum to keep going.
Right? Because the operators out on the floor, like, if it makes their lives easier and they see that it does or gives them data to back up all the problems that they’ve been having to go to the supervisor or their manager to explain what the issues are, they’ll keep putting information into the system. They’ll keep interacting with it, and you can leverage that to do more and drive more efficiency out of the process and also get them more engaged as well. Because they’re the ones on the front line.
The supervisor’s the ones on the front line, and they’re the ones seeing the problems every day, and they know what the issues are. Right?
And if you get them engaged, they’ll help fix the issues.
One of the things that Elsa all also saw is, employee retention went way up after implementing one of these systems because they were able to fix all these problems that people were were dealing with all day, and they were getting beat up for. So, you know, for example, if I was having low performance on a on a welding station or something because, you know, I had I had issues with the welders. I had issues with, maybe the the the guy upstream for me was not welding things correctly, and I had to fix it. Now that stuff is recorded, and they know how often it happens. And, oh, we’re gonna fix that problem with the guy upstream for me, and now I’m not being beat up for my performance numbers anymore. Right? So it makes people happier.
So this is a an example of what the full process might might look like.
So, you know, we have companies that start out with just machine monitoring. Is it up? Is it down? Right?
Maybe you have a reason code for why. The next step is I wanna know up and down, and I wanna start tracking counts, and I wanted to track against my schedule. Am I gonna be am I gonna deliver on time, or am I running behind, and am I gonna have to run overtime this weekend? Right?
It helps you avoid those things.
Then folks start to add in scrap tracking, head counts, individual operators at different machines, and all of these steps can help you get more information to help drive more efficiency out of these processes. And then finally, at the end, like, a full digital factory where you have digital quality inspections and work instructions. And, basically, everything’s contained within the system, and nothing’s happening outside of it. So it makes it really easy to report on and understand where your bottlenecks are.
And what’s cool is we see people move through this whole continuum very quickly, like a year. Right?
It doesn’t take forever forever to do this because it’s relatively relatively easy.
Alright. And if anybody else has questions, feel free to to jump in.
So let’s pivot over to another I idea. And we talked about this a little bit on on how Elsa did it, but this is the idea of a power of a single data point.
So Ice Industries is a is a company. It’s got a lot of different plants, and they’re mostly stamping and metal forming.
And we’re this case study we’re talking about here is a plant down in Grenada, Mississippi that makes, parts for generators and and trucks and stuff like that.
And on each one of their machines, they have just they’re just getting a count, right, number of strokes, right, on each one, and that’s it.
The with that one data point, they were able to drive a lot of improvement and something maybe a little bit unexpected, which was inventory accuracy.
So they’re making thousands of parts per hour. And you can imagine if I’m an operator and we’re making thousands of parts per hour let’s say I’m supposed to make two thousand parts per hour. I’m gonna write down on my piece of paper. If even if I made nineteen fifty, I’m probably gonna write down two thousand.
If I made twenty one hundred, I’m probably gonna write down two thousand, right, over and over and over again. It’s just the way it works. Or maybe I’m off. Like, if even if I’m off ten parts every single hour, that adds up over time.
Right? And it causes you to not have faith in your inventory. It causes you to do more, cycle counts to be able to make sure that your inventory is is correct. It also causes you to carry more inventory because you don’t have faith in the actual numbers.
Right?
And so what happened was with the automated production reporting and then pushing data into their ERP system, they got a hundred percent inventory accuracy on their finished goods.
They and it I’m not allowed to share the numbers, but they’re they were astronomical, the the inventory adjustments that they would do at the end of the year. And it’s not like parts were walking out of the plant. It’s just misreporting that adds up because the numbers are big over the course of, you know, a month, a quarter, a year. Right?
So this is this illustrates a really good point in that you only need one data point to drive this kind of improvement. Right? You don’t need gigabytes of data. You don’t need tons of data scientists.
You don’t need AI. You don’t really need anything fancy. Right? You just need something that is measurable, understandable, and actionable.
Right? And what that thing is, and I kinda I alluded to it earlier, but it’s just a count. Right? Because with the count, you can get the inventory accuracy.
Your production counts can be right.
Using the count, when it stops counting, you know the machine’s down. Right? And and somebody can manually put in what the reason code is. Now you get really consistent, predictable downtimes and counts.
Right? Which is the biggest problem for most companies. Like, quality, again, is usually handled. Like, there’s tons of processes around it because if you ship bag product, you’re not gonna be in business very long.
But you can deal with, you know, slow running. You can deal with downtime, all kinds of things like that. But this gives you the data to really help improve, that, just that one little data point. And as you think about this continuum, right, like, this is the very beginning.
Like, you can collect the other stuff later based on what you learn. And we’ll talk about another case study with that in a little bit. But just start super simple. Account.
Yes. Maybe you can talk to your PLC and pull tons of data out of it.
But more data is just more stuff to sift through. And at the end of the day, where all the improvement comes initially is on performance, which kinda Tom alluded to, and then downtime reduction.
So Bryan, I have a question.
You mentioned in that case study that or you oh, like, I think, overall, you stated that that process could happen within a year. I mean, that quickly. I’ve that spent a lot of time in manufacturing. And were there any special conditions around that that, you know, you gotta have this, this, and this, and you’ll be able to get through quickly. It just seemed like a year was really fast to me.
The I mean, really, the the special thing that you should have is just someone internally that is strong to lead a project.
Like, you know, we we can help, but it has to be you know, change has to be driven from within.
And the the places where we had somebody strong who who kinda followed the process that we laid out, put that North Star, got everybody on board, it, yeah, it goes really fast.
Twelve to eighteen months. Like, people go from, you know, just counts and measuring against the schedule all the way into the, digital factory side of things.
And the the difference not to toot our own horn a little bit here, but this thing was built eighty percent out of the box. Like, it’s there’s not a lot of configuration. There’s not a lot of customization that needs to happen, and that’s part of the reason why you can move so quickly.
And it was designed so that you really don’t outgrow it.
Great. Thank you. That that really helps. And I think the idea that it’s doesn’t need to be configured is probably what a lot of us have dealt with in the past. It’s always been a a roadblock. So Yeah.
So Tom’s got another question.
Infrastructure additions, like sensors, are needed to get clarity on performance?
So that’s it’s another good question, Tom.
Half the time, we’re pulling data off of an existing sensor or PLC, and then the other half of the time, we have to add some kind of sensor to get performance and downtime.
So, really and it it depends on, like, the customer’s infrastructure. So they might have PLCs that we can talk to, but maybe they can’t be networked, or there’s cybersecurity restrictions. So it’s kind of a a a mixed bag on the two.
So to cover I I talked about this, but just to put a finer point on it, because we’re talking supply chain here.
These these accurate counts are kind of a big deal, right, because we’re reducing finished goods inventory.
Elsa did this too. Like, they I mentioned he’d go through this whole this whole presentation, but they used to keep, I think, two days worth of inventory on hand, and now it’s down to a shift.
You know, Ice I I don’t know what their turns are, but, I mean, they dramatically reduced their finished good inventory, which reduced their carrying costs.
They also used to have people come in on the weekends every single week to do cycle counts, and they were paying overtime to do that.
He didn’t share the the dollars there, but I they’re significant. Right?
You can imagine paying overtime for a I I think it was a team of two or three people to come in on a Sunday and do those counts. Like, it it’s not cheap.
So alright.
So another case study that that’s gonna, I think, highlight another process for us. So we we talked about the start small, start simple, think big, move fast, which is kind of the overarching implementation process that we discussed. And then, you know, starting small is that single data point that’s the best place to to begin your journey.
The next part of this is, like, okay. We’re implemented. We have our single data point. Now how do we handle the improvement process? The day to day and then the longer term strategic improvement on that. And this company, Louisiana Fish Fry, is a really good example of this, and they actually coined the term that we use going forward, which is getting to green.
And what what they did, was they came up, like, with this concept to help drive improvement.
It’s very simple. It’s iterative. It’s visual. And, basically, all you have to do is react, analyze some data, and then go improve.
Seems simple. It it’s not that simple, but we’ll we’ll talk about that. And the the whole getting to green idea is that on the day to day basis, it helps you manage the plant. So the production monitoring systems help with real time communication and visibility, help you stop the problems as they’re happening, meaning let’s get the people to the line very quickly to get it back up and running as quickly as we can.
And then on the other side, like long term strategic, what are our areas for improvement? Maybe where should we invest in automation? What are the biggest downtimes that we’re seeing?
And so with Louisiana Fish Fry, what they were able to do by putting up visual displays and having alerts to get the right people to come over to the lines when they were having problems, they were able to drive a twelve percent increase in OEE in the first nine months.
And what’s interesting about them is they moved off of a different production monitoring system, onto ours. So they they weren’t going from Excel to a production monitoring system. So you can imagine when you go from paper and Excel to a system, your bump’s gonna be bigger. Right? We see a ten to twenty percent bump in the first in the first year because of, you know, the accuracy of of the data.
And they also used kind of the long term analysis of the data to understand what spare parts they needed to have on hand based on the different downtimes and breakdowns of the machines, and then also the flexible reporting to really understand where the problems are. Right?
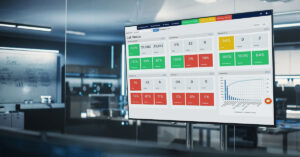
So what you know, they they foster this idea of green is good, and then we kinda renamed it to getting to green. And what this looks like, to break it down into the two buckets, is on the real time, like, day to day side of things, they have, scoreboards that are out on the floor that look like this.
And on the right hand side, they’re color coded metrics. So here we have OEE, and then we have performance, so the run rate, and then we have availability. And these two are owned by different groups. So if the speed or run rate drops out of the green, a production supervisor gets notified.
If availability drops out of the green, somebody in maintenance gets notified, and that person is required to go over to the line, find out what’s going on, and help them until it goes back into the green. Right? So this is like the idea of stopping problems as they as they happen.
And so this is a display out on the floor so everybody can see it, but then they’re also getting alerts when this stuff happens. So, like, when it drops out of the red sorry. Drops out of the green into the red, you know, maintenance is gonna get a notification. They’re gonna be sent over to that line and then help them get back up and running. What the way things happen today, most of the time, you might have a radio or a phone or some people use Teams, right, to be able to find a production supervisor, to be able to find a maintenance person to help you with a problem. It takes time. It could take twenty twenty, thirty minutes to to track somebody down to help you with something.
And this way, they get it automatically, proactively.
Right? And you can also measure how long it took them to come over to the line, and they get over to it and help you get back up and running. So it eliminates just a lot of downtime of running around and trying to find people.
And then on the longer term side of things, we’ll start with a little case study here first.
This is H&T Waterbury. They make battery components. You never heard of them. Guarantee you use their products every day. It’s the outside container of a AA, AAA, C, D battery. There’s a metal container on the outside of those. They make billions of them a year in in Waterbury, Connecticut.
And they implemented a production arm production monitoring system, And they found out that every single week, they were having eight hours of downtime due to this backwards can issue, and it was a short stop. They lasted fifteen seconds or less. So a backwards can is when this canister turns upside down, and it can’t get this coating sprayed on it. It makes a bad part, and so the line stops when that happens.
And the operator has to walk over, turn the can right side up, and then hit a button to start it. It’s, like, very fast. All the operators are taught how to do it.
Everybody knew it was a problem. They just didn’t know how bad it was. When you added it all up, eight hours per machine every single week. Right? It’s a shift. It’s unbelievable.
And so what they did was is they would look at the dashboards and the data, and we’ll see some examples of this, see what the biggest downtime was. They would go out. They would make some changes. Right?
Let it sit for a week. Go back to the dashboards. Okay. Did it get better?
Did it get good enough? Okay. No. Let’s make some more changes. They went around and around and around using the data to drive this improvement, and, eventually, they eliminated seventy one percent of that downtime, which is astronomical.
I mean, billions of parts a year. Right? They were able to not run a shift for a certain amount of time. Like, it was pretty pretty impressive.
And this is kinda what that looks like. So this isn’t their data. This is just some some demo data, but this is like a a Pareto chart where that’s showing downtime codes. Right? And we can see very even if you’re not familiar with Pareto charts, you can see that, like, that’s the biggest one. This this says we have most of our downtime is coming from waiting on quality, and number two is a material issue.
And this is just showing information from yesterday. So you could look at this in a meeting and say, okay.
Quality is maybe in a production meeting with you, and you say, okay. Quality, Jimmy from Quality, what’s going on here? It’s like, oh, you know, Phil was out yesterday. We were short staffed. That’s why it happened.
Okay? But then you also have the data longer term to say, okay. For the last thirty days, what’s our biggest issue?
It’s pretty clear. Right? Still waiting waiting on quality.
Actually, materials went went up, yesterday versus the the thirty day, total.
And so you can kinda sit there and be like, okay. No. This is a bigger problem. Like, what are we gonna do about it? But it makes it very obvious, and it makes it really easy to look at this stuff on a regular basis to see if the changes you’re making are really improving or not, which really brings us to the last step in the process of, like, how you do this. And this is a standard, manufacturing process called PDCA or plan, do, check, act.
And very simply, it’s planned. Like, planned meaning, like, we’re looking at the data. We’re seeing that, you know, waiting on QA is our biggest problem. So what’s our plan to to fix this? Right? So we develop plan, usually put together a task to be able to track that. Then we go out and make the changes to fix it.
And then we wait a couple days or maybe a week to see what it did. Right? We check it. So did it work?
And then based on those results, we take the next step. We act. So maybe, you know, at H&T, because it took a while to figure that out because it’s a relatively complex problem, Okay. We reduced it by ten percent, but we’re really shooting for seventy percent plus downtime reduction.
So let’s go out and figure out what we’re gonna do next, and we just iterate on this over and over and over again, right, until we drive the improvement out of it.
And most of our customers are are looking at this stuff on a daily basis in a cross functional, production meeting, you know, where you have, like, your production team, your engineering, maintenance, and quality so you can help solve problems. And then there a lot of times, they’re doing the PCDA stuff, like, on a weekly basis, maybe on a Friday, because you have enough data at that point to check if things are are working or not.
Right?
So last thing that I wanted to cover is, how do I know what I can achieve? Right? Like, all this is well and good. You’re telling me ten to twenty percent increases. Like, you’ve laid out this process and what we should track.
And how do I know, like, what I could achieve at at at our plant or our company if we did something like this? And I don’t know if somebody wants to give me their numbers, but I have a interactive calculator, that we could do.
But it’s, I I call this the gut check calculator, and it it allows us to put in how many weeks per year do we run. So, like, most most companies do fifty. We have a couple weeks of shutdown. How many days per week?
How many shifts? How many hours? And then this is the big question. So the hourly rate, what does it cost to run a machine for an hour with labor and overhead?
We put eighty in here because it’s a pretty good approximation for a single person and a single machine.
But I don’t know if anybody on wants to give a number, or we can I can use some examples?
Looks like no. So that’s okay.
So the reason why I call this the gut check calculator is at eighty dollars an hour, let’s say I have twenty four lines or machines that I’m I’m running.
You can look at the results and it says, okay. To achieve a one percent increase in OEE, I’ll save about thirty eight thousand dollars based on this number. And that math assumes, like, I have people standing around doing nothing right now. Right? And I I can’t absorb any of their their labor and overhead into a product that I sell through just standing around.
And when I increase the OEE by one percent, now they’re working that amount of time.
And so to increase your OEE by one percent, you need to save five minutes per machine per day. Five minutes.
Right? And, usually, what you ask yourself is, like, can I do that? Do we have five minutes on a machine or a line?
Probably. Right? Might probably have thirty. So that’s kinda what you know? And then and then we go in five step increments here to say, okay.
Five percent is about twenty four minutes per machine per day. And if you have multiple shifts, like, it’s even less. Right? If I have two shifts, it’s twelve minutes.
Right? I mean, these are somebody’s gotta go to the bathrooms.
Not people still have to go to the bathroom, but, you know what I mean? Like, these downtimes that you have to reduce are very small.
And it’s not only downtime, it’s also performance. Like Tom was talking about before, if you have a process where performance varies a lot, if you can dial that in and make it more consistent and get back more time from increased performance, it’s the same thing as reducing downtime. Same thing with scrap reduction. Same thing with rework reduction because you’re not having to do this stuff over and over again.
And then when you when you really blow this out, you think about, like, the average Nulogy customer does a ten to twenty percent bump in OEE, in that first year, you know, with eighty eighty dollars an hour, with twenty four machines, ten percent’s three hundred and eighty four thousand dollars. Twenty percent’s seven hundred and sixty eight. It’s a lot.
And these things are realistic. So, anyway, it’s a we always like to call it the gut check calculator because in some cases, maybe it’s just labor. You got one person and one machine. It’s twenty five bucks an hour. It makes it a little harder. But most manufacturing companies at the higher, hourly rates, like, it it makes a big impact. Right?
Alright. So what other that was actually the end of my presentation. So what other questions do folks have with fifteen minutes left?
We can open it up. Anyone questions? Has a great ROI, pool. That was really, really obvious. They’re very cool.
What’s cool about the ROI is it’s like it’s not really system specific. I mean, you could take some of these tools and apply them now even if you’re collecting stuff on paper.
And if you can get that one percent bump, you’re still gonna see that, you know, that return on investment. Right? Like, you can you can still drive without a system. You can still drive a lot of improvement, in OEE using the processes that we talk about. It’s just you kinda top out at that sixty five percent without automated data collection because you just can’t get granular enough.
Tom, you have any more? You’ve had some really good questions through, through the whole presentation.
I’m good. Thank you. But, I do appreciate the overview. Thought is well done.
Alright. Well, if that is it then, as I mentioned, we will be sending, this out, and it is available. It will be available on our website as well.
But, you know, if you have any questions, please feel free to reach out to myself or, Bryan or Nulogy, and I know they’d be more than willing to help you. So oh, Paul says quick question. Go ahead, Paul.
He said, what percent of CPG are using a system track?
Oh, there it is.
That’s a good question. I don’t know exactly.
What’s interesting I can’t give you a percentage. I can just give you anecdotal information, which is, ninety percent of our new customers, it’s greenfield, meaning they don’t do anything. Like, it’s Excel and paper and whiteboards, and there’s no system.
And we do a lot of CPG in food and food and beverage and and things like that. And even industries that you would think would be really advanced, like automotive, aerospace, injection molding, blow molding.
So it I think it’s a pretty low percentage.
And, I’m the only Bryan Sapot in the world, so feel free to I didn’t put my LinkedIn on the questions page, but feel free to link you know, look me up on LinkedIn and connect, and I’m happy to answer, any questions.
So Alright.
Anyone else with a question?
Alright. Well, you know how to get in touch with Bryan. Thank you, everyone. Thank you, Bryan, and have a wonderful day.
Thanks, everybody. Bye.
Bye.